Marco Island Real Estate Market Update | October 2026
Fewer closings and tighter inventory on Marco Island, while single family homes sell faster
Published November 2026
Listen to this report
Market Analysis
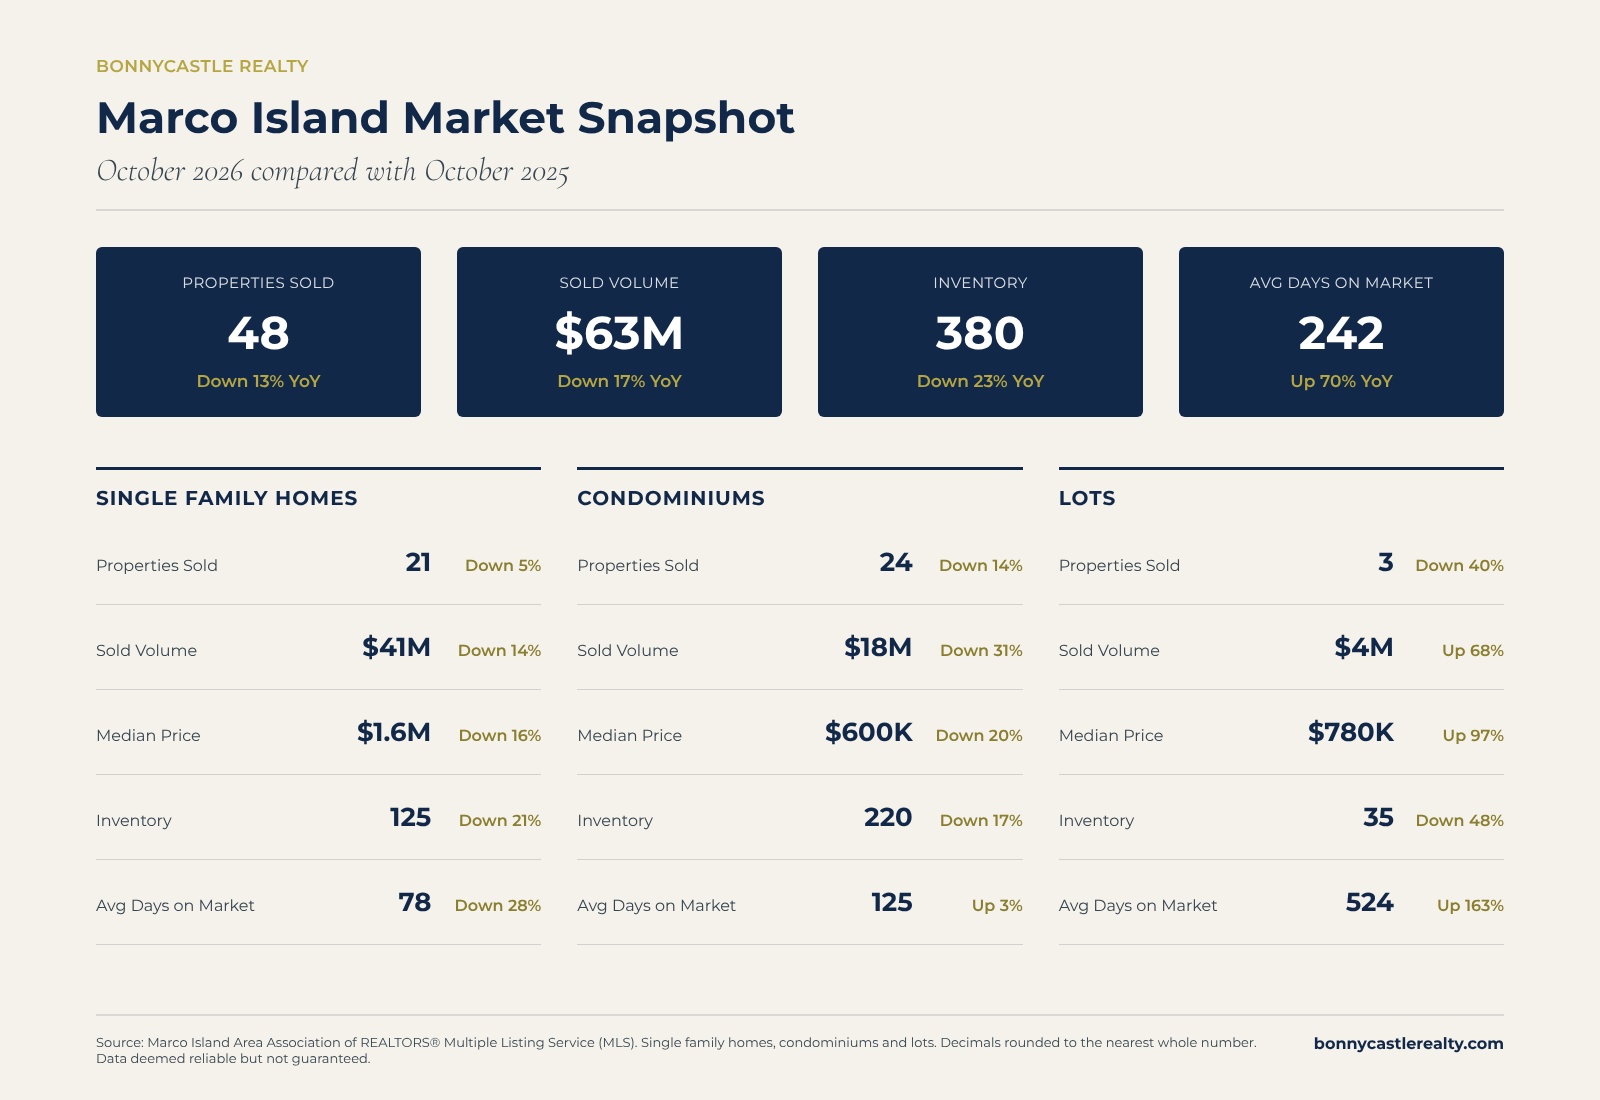
Marco Island enters the season with fewer properties for sale and fewer closings than a year ago. In October 2026, 48 properties sold, down 13% from October 2025, and sold volume came to $63 million, down 17%. Inventory fell 23% to 380 properties. Homes, condominiums and lots are moving in different directions, so we look at each on its own below.
Sales Activity Eases
Closed sales slowed across most property types in October. Condominiums led with 24 sales, down 14%. Single family homes recorded 21 sales, down 5%, and lots recorded 3 sales, down 40%.
Sold volume followed the same pattern. Single family homes accounted for $41 million, down 14%. Condominiums reached $18 million, down 31%, the largest decline of the three. Lots were the exception at $4 million, up 68%, though on only three closings.
With such a small number of sales each month on the island, a few transactions can move these percentages noticeably, so we read them as direction rather than precision.
Inventory Continues to Decline
Supply is tighter in every category. Marco Island had 380 properties for sale at the end of October, down 23% from a year ago. That includes 125 single family homes, down 21%, 220 condominiums, down 17%, and 35 lots, down 48%, roughly half of last year's count.
For buyers, selection is narrower than it was last fall, particularly for lots. For sellers, there is less competition from other residences on the island.
Pricing Trends Vary by Property Type
The median single family sales price was $1.6 million in October, down 16% from a year earlier. The median condominium sales price was $600,000, down 20%. Lots moved the other way, with a median of $780,000, up 97%, reflecting a very small number of closings and a different mix of lots than last October.
Median prices on a small island market can shift with the mix of residences that close in a given month, so we would not read a single month as a trend on its own.
Time on Market Shows a Split
Average days on market across all property types was 242 days, up 70%. That figure is driven largely by lots, which averaged 524 days, up 163%. Single family homes moved noticeably faster, averaging 78 days, down 28%. Condominiums averaged 125 days, up 3%, essentially level with last year.
The overall average can be misleading here. For residences, the more useful numbers are the home and condominium figures, and single family homes are clearly moving faster than they did a year ago.
The Bonnycastle Perspective
The October numbers describe a quieter island market. Fewer residences are available, fewer are closing, and prices on both homes and condominiums sit below last October. At the same time, single family homes are selling more quickly, which suggests well presented residences continue to attract attention.
For buyers, lower prices and a faster pace on homes mean preparation matters. For sellers, limited competition helps, and pricing in line with recent closings remains the clearest path to a timely result.
If you'd like to talk through what this means for your residence or your search, send us a message.
Source: Marco Island Area Association of REALTORS® Multiple Listing Service (MLS). Comparison of October 2025 and October 2026. Property types measured are Marco Island single family homes, condominiums and lots. Decimals are rounded to the nearest whole number. Data deemed reliable but not guaranteed.
Get Your Home's Value
Curious what your home is worth? Get an instant market-based valuation and a detailed report.
Get Home ValuationQuestions About This Report?
Our market experts are here to help you understand these trends and how they impact your real estate decisions.
Contact Our Team