
Marco Island Real Estate Market Update | September 2026
September 2026 Marco Island Real Estate Market Update
Published October 2026
Market Analysis
The Marco Island real estate market showed mixed results in September, with overall sales holding steady while inventory declined and average days on market increased. Condo sales activity strengthened, while single family home and lot sales declined compared with September 2025.
Sales Activity Holds Steady
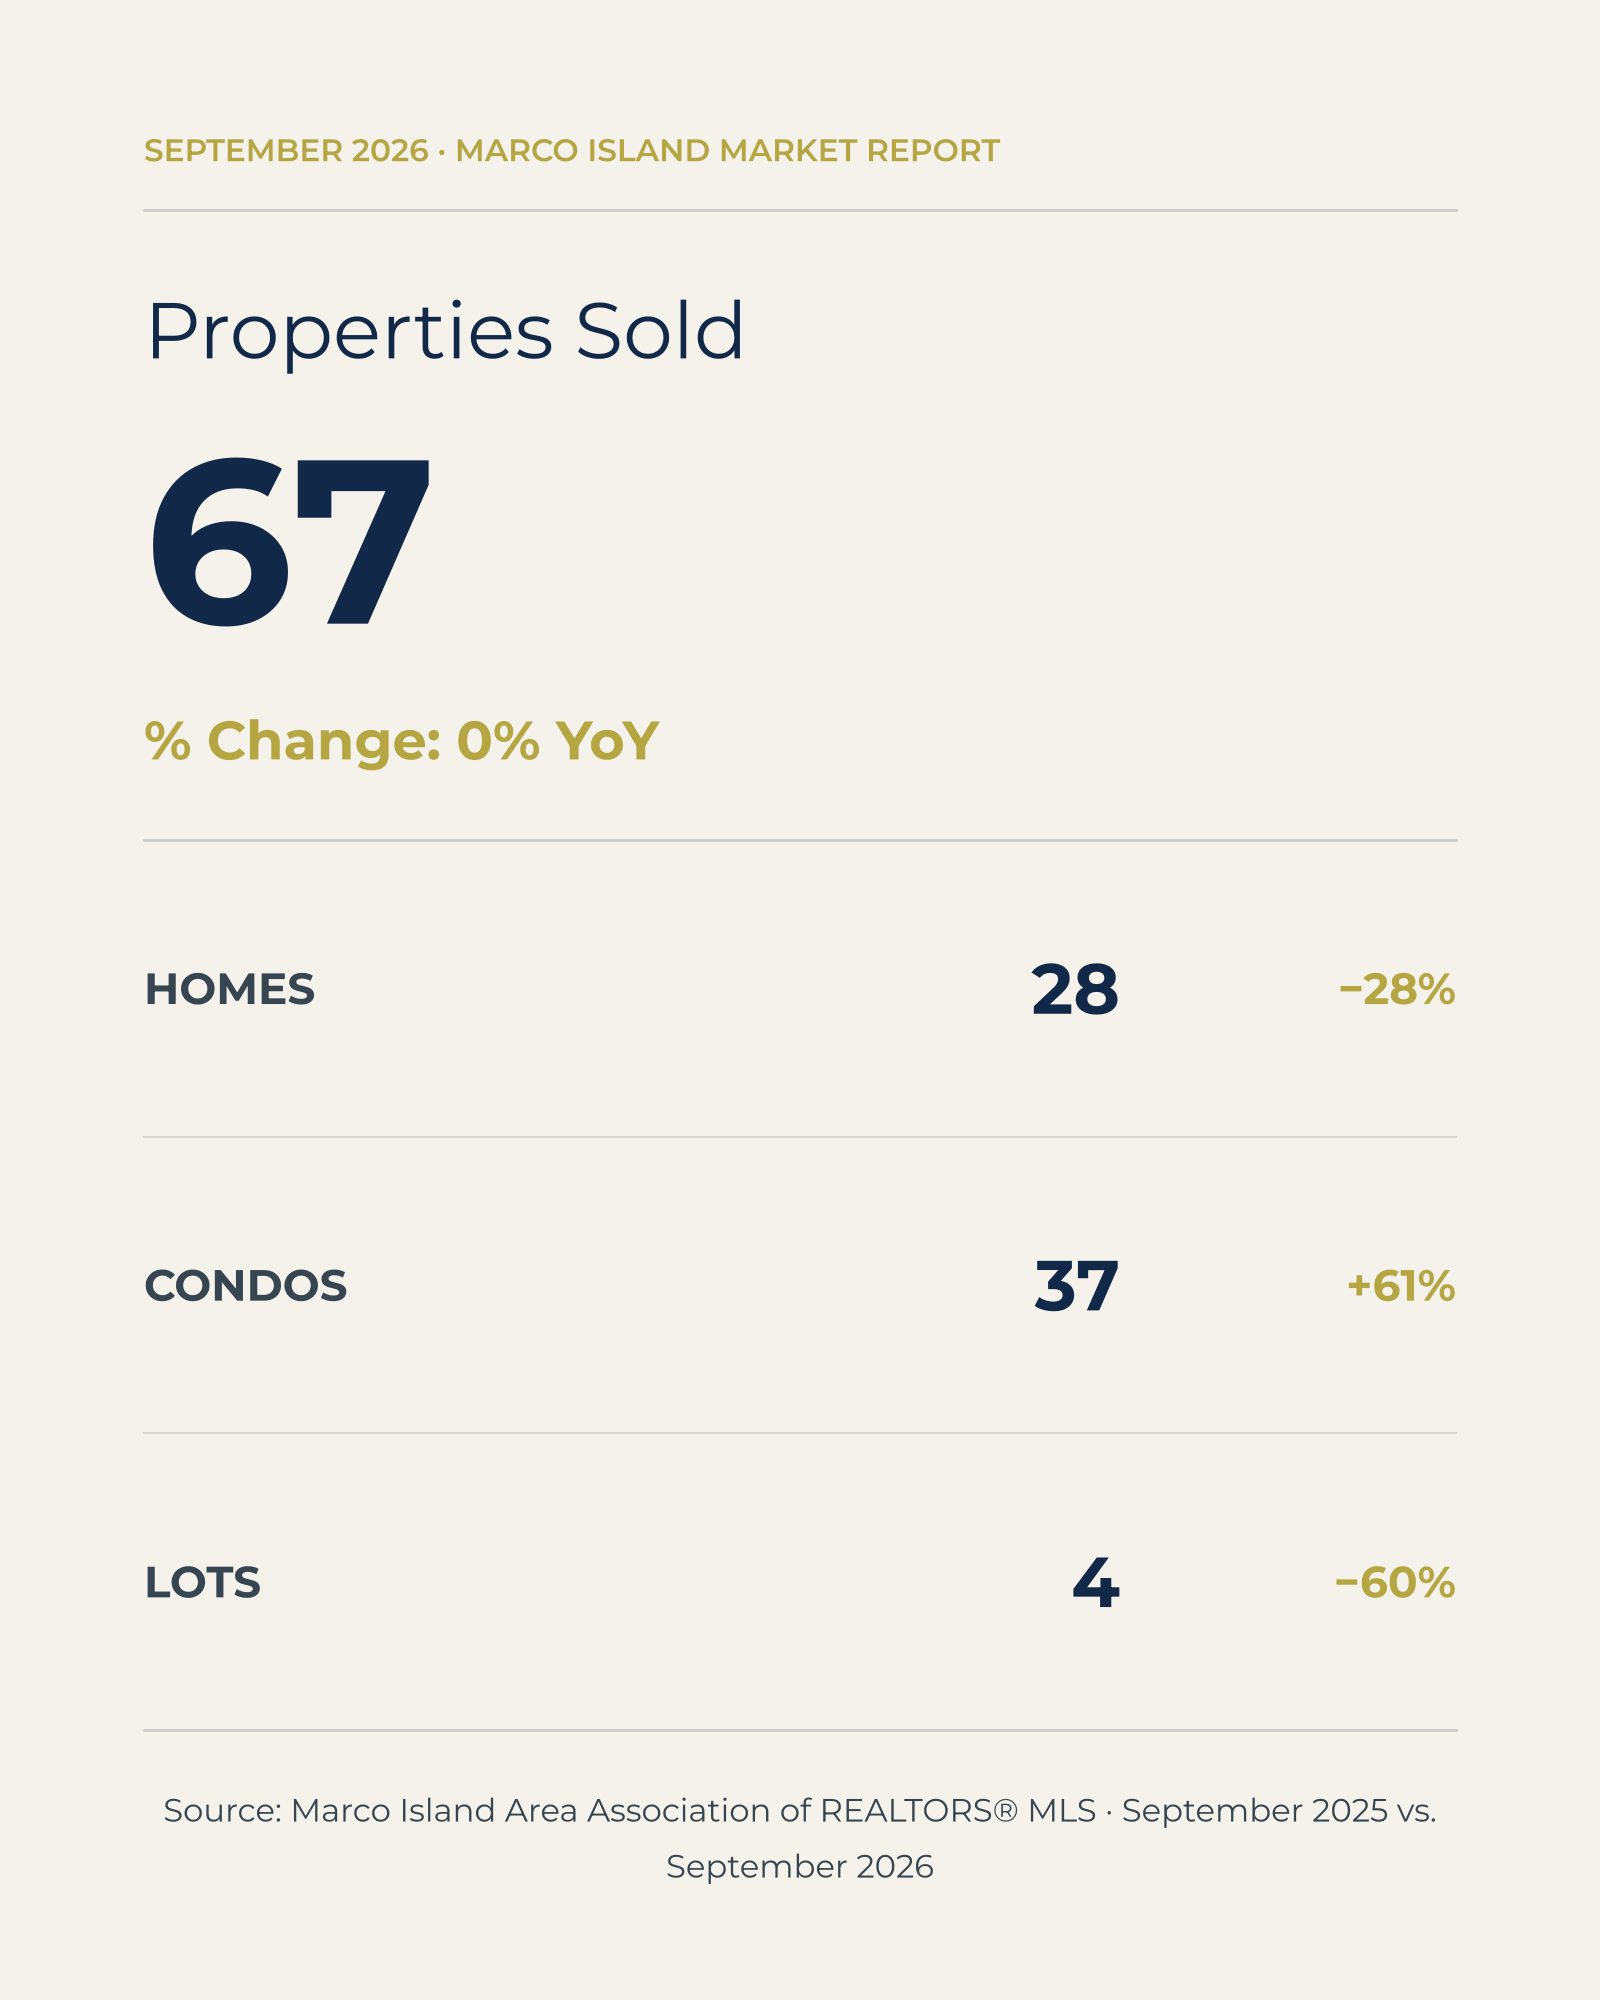
Marco Island recorded 67 properties sold in September, unchanged from September 2025. Activity varied by property type. Condo sales increased 61% to 37, while single family home sales declined 28% to 28. Lot sales declined 60% to four.
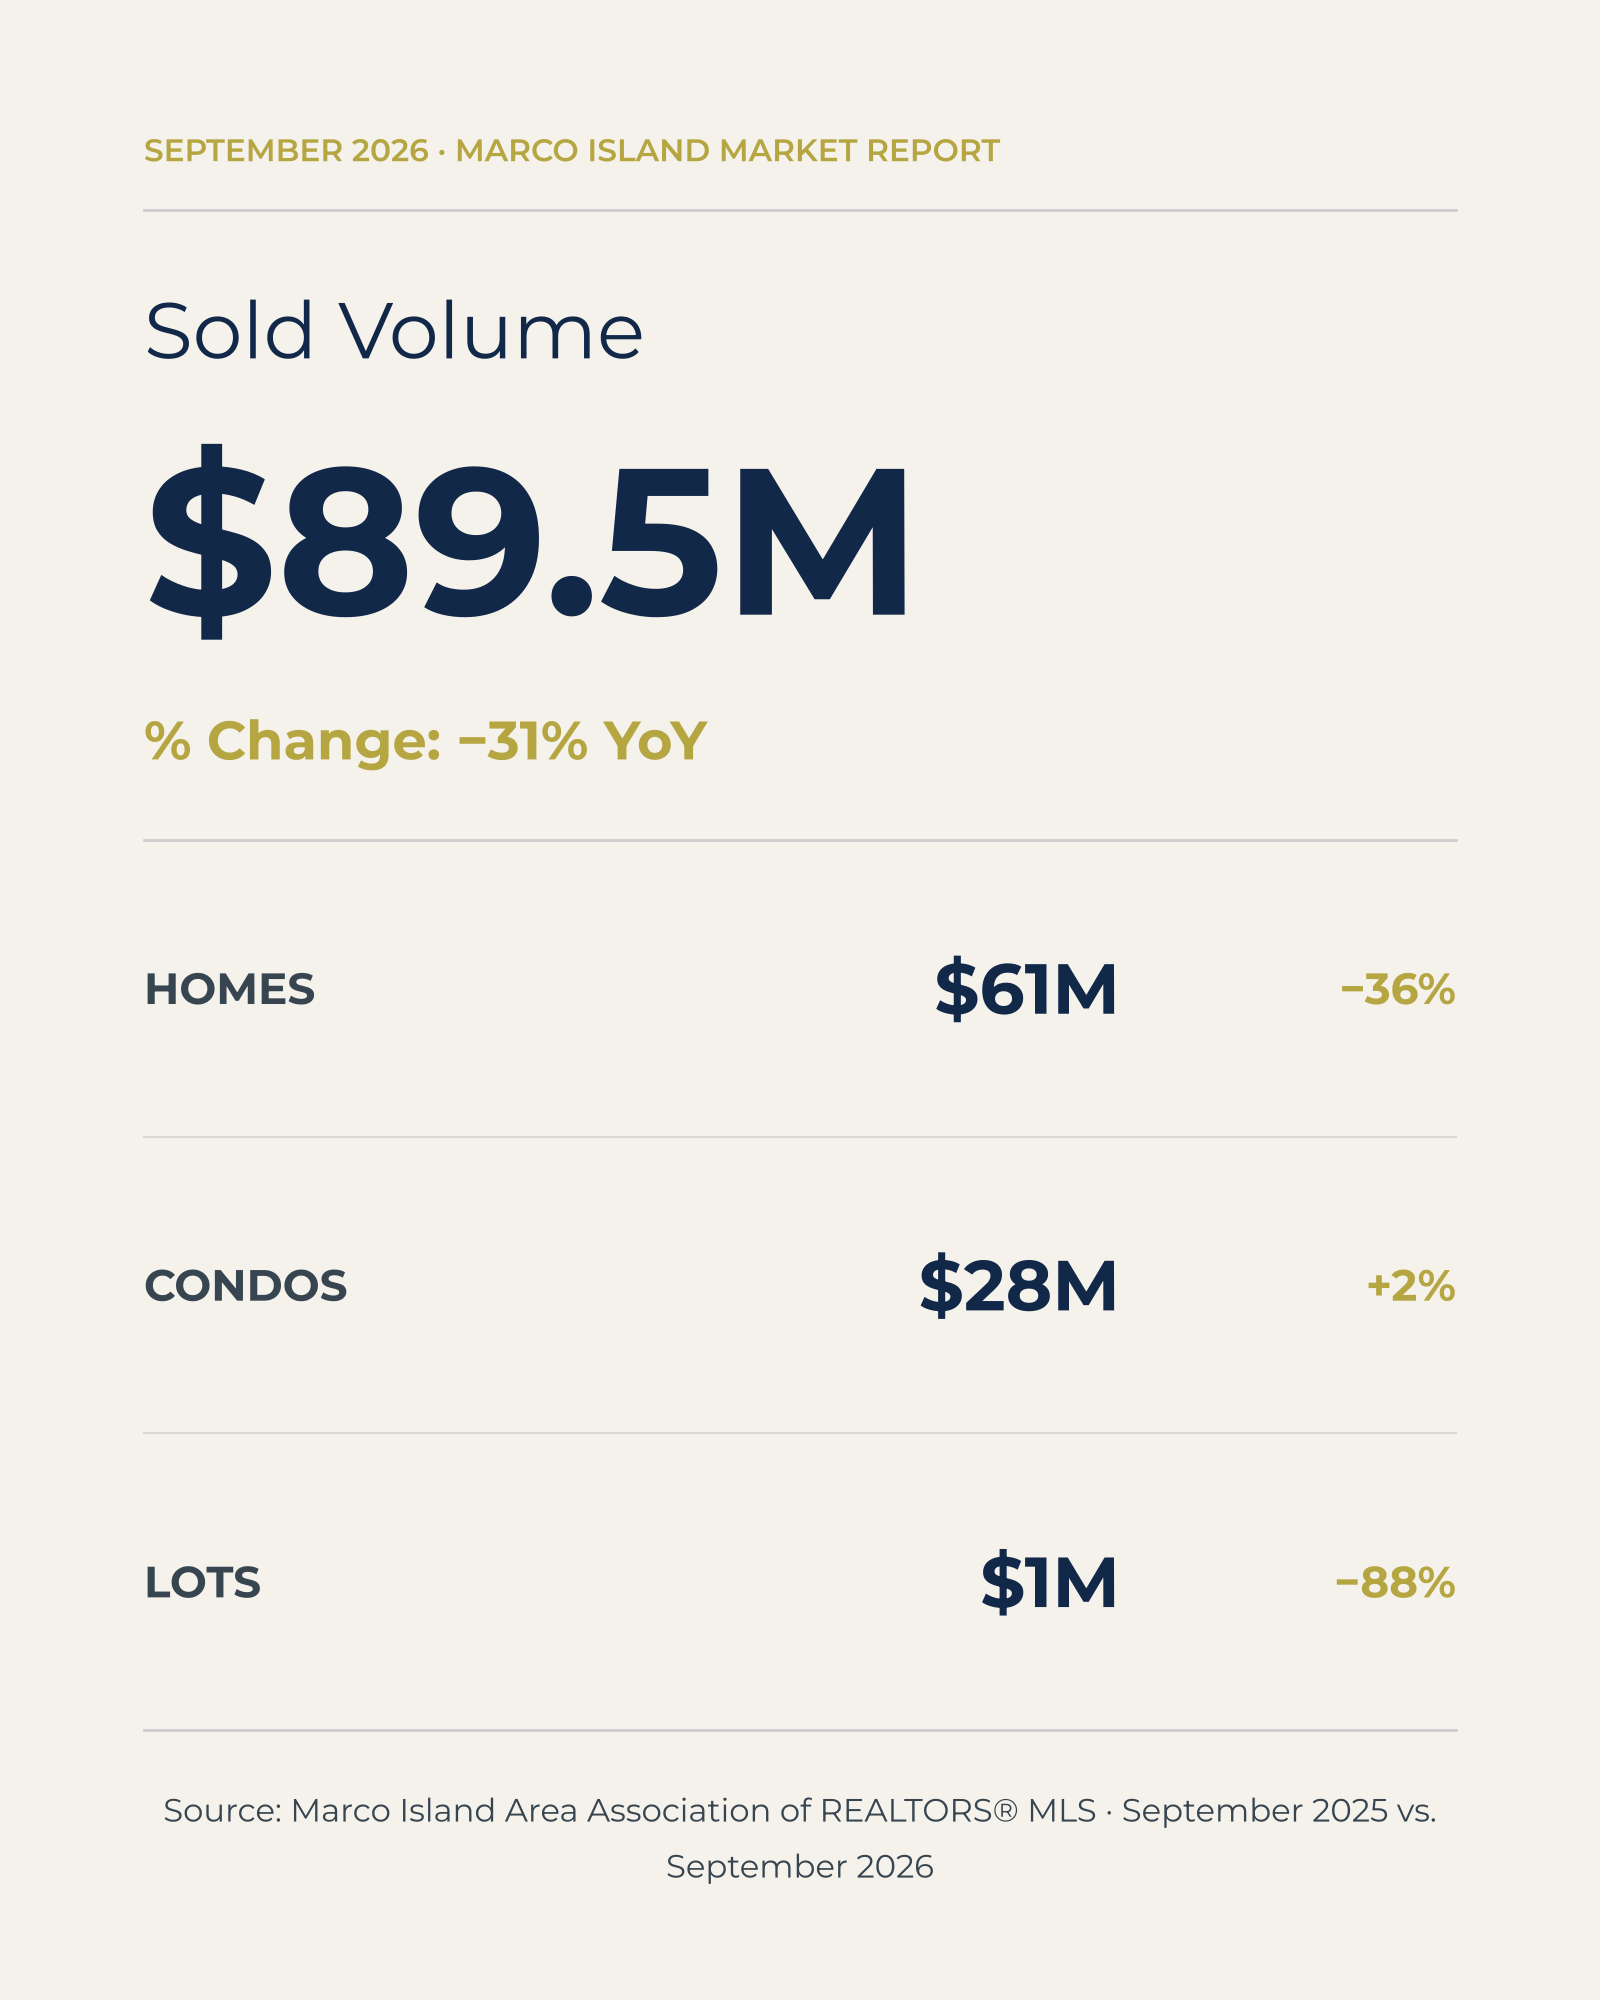
Total sold volume reached $89.5 million, down 31% from the same period last year. Single family home sales accounted for $61 million in volume, down 36%. Condo volume reached $28 million, up 2%, while lot volume totaled $1 million, down 88%.
Inventory Continues to Decline
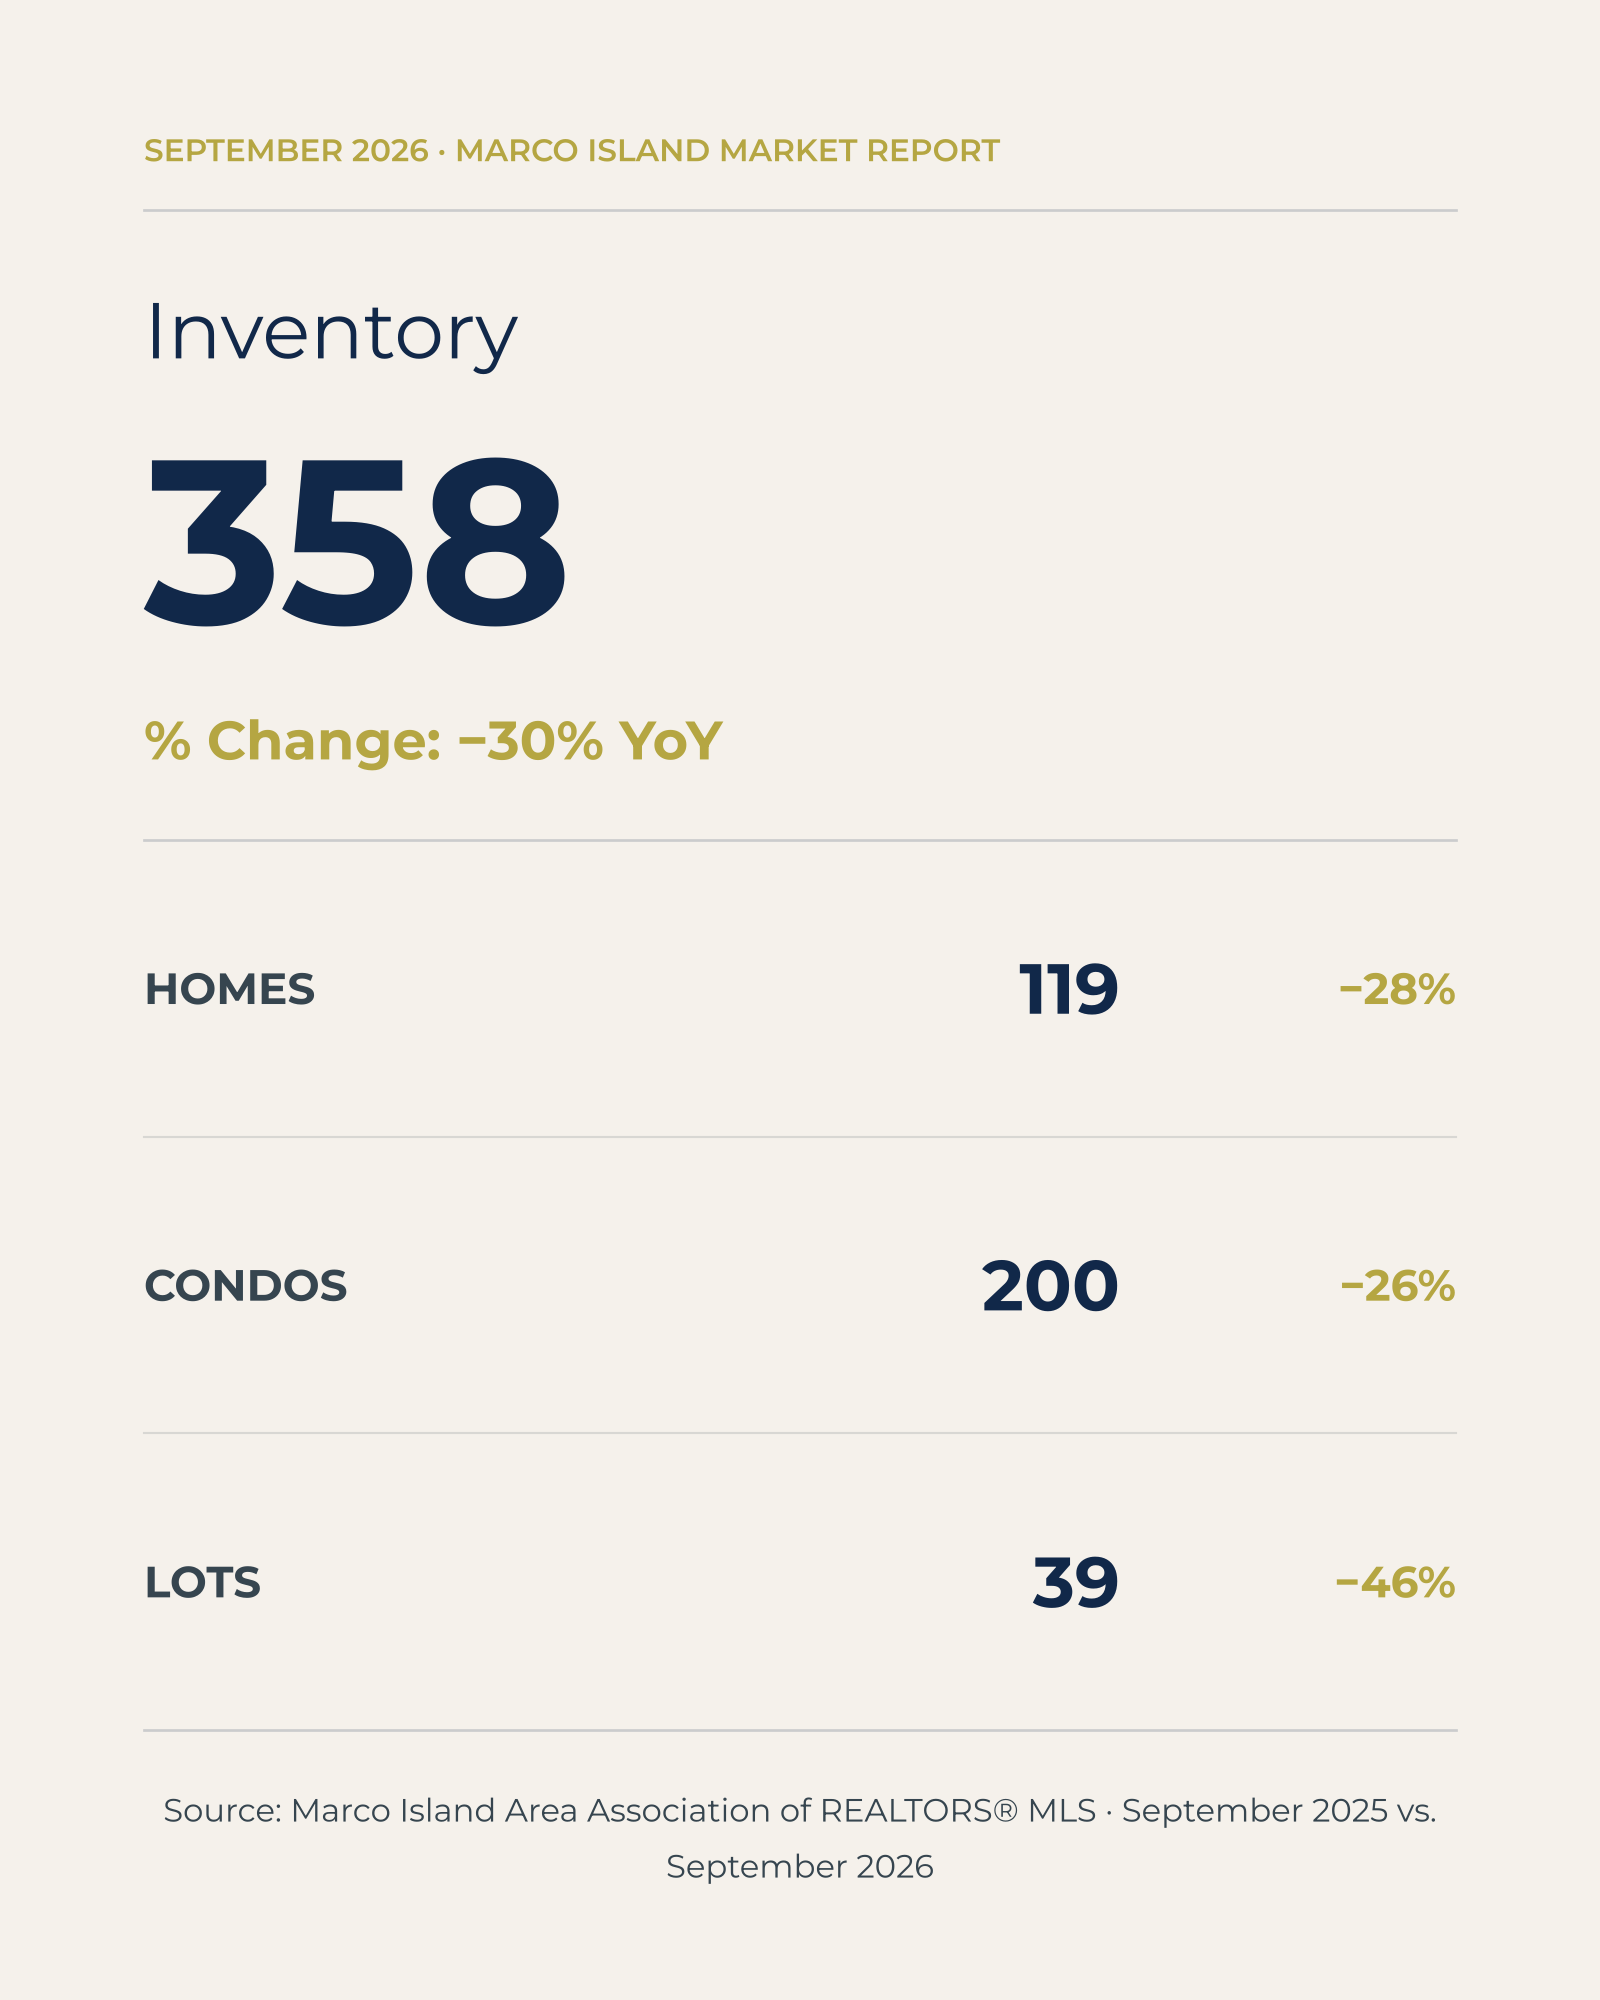
There were 358 properties in inventory in September, down 30% from September 2025. This included 119 homes, down 28%; 200 condos, down 26%; and 39 lots, down 46%.
The decline means buyers had fewer listed properties to choose from than a year earlier. For sellers, reduced inventory can mean less direct competition, although pricing and property condition remain important when attracting buyers.
Pricing Trends Vary by Property Type
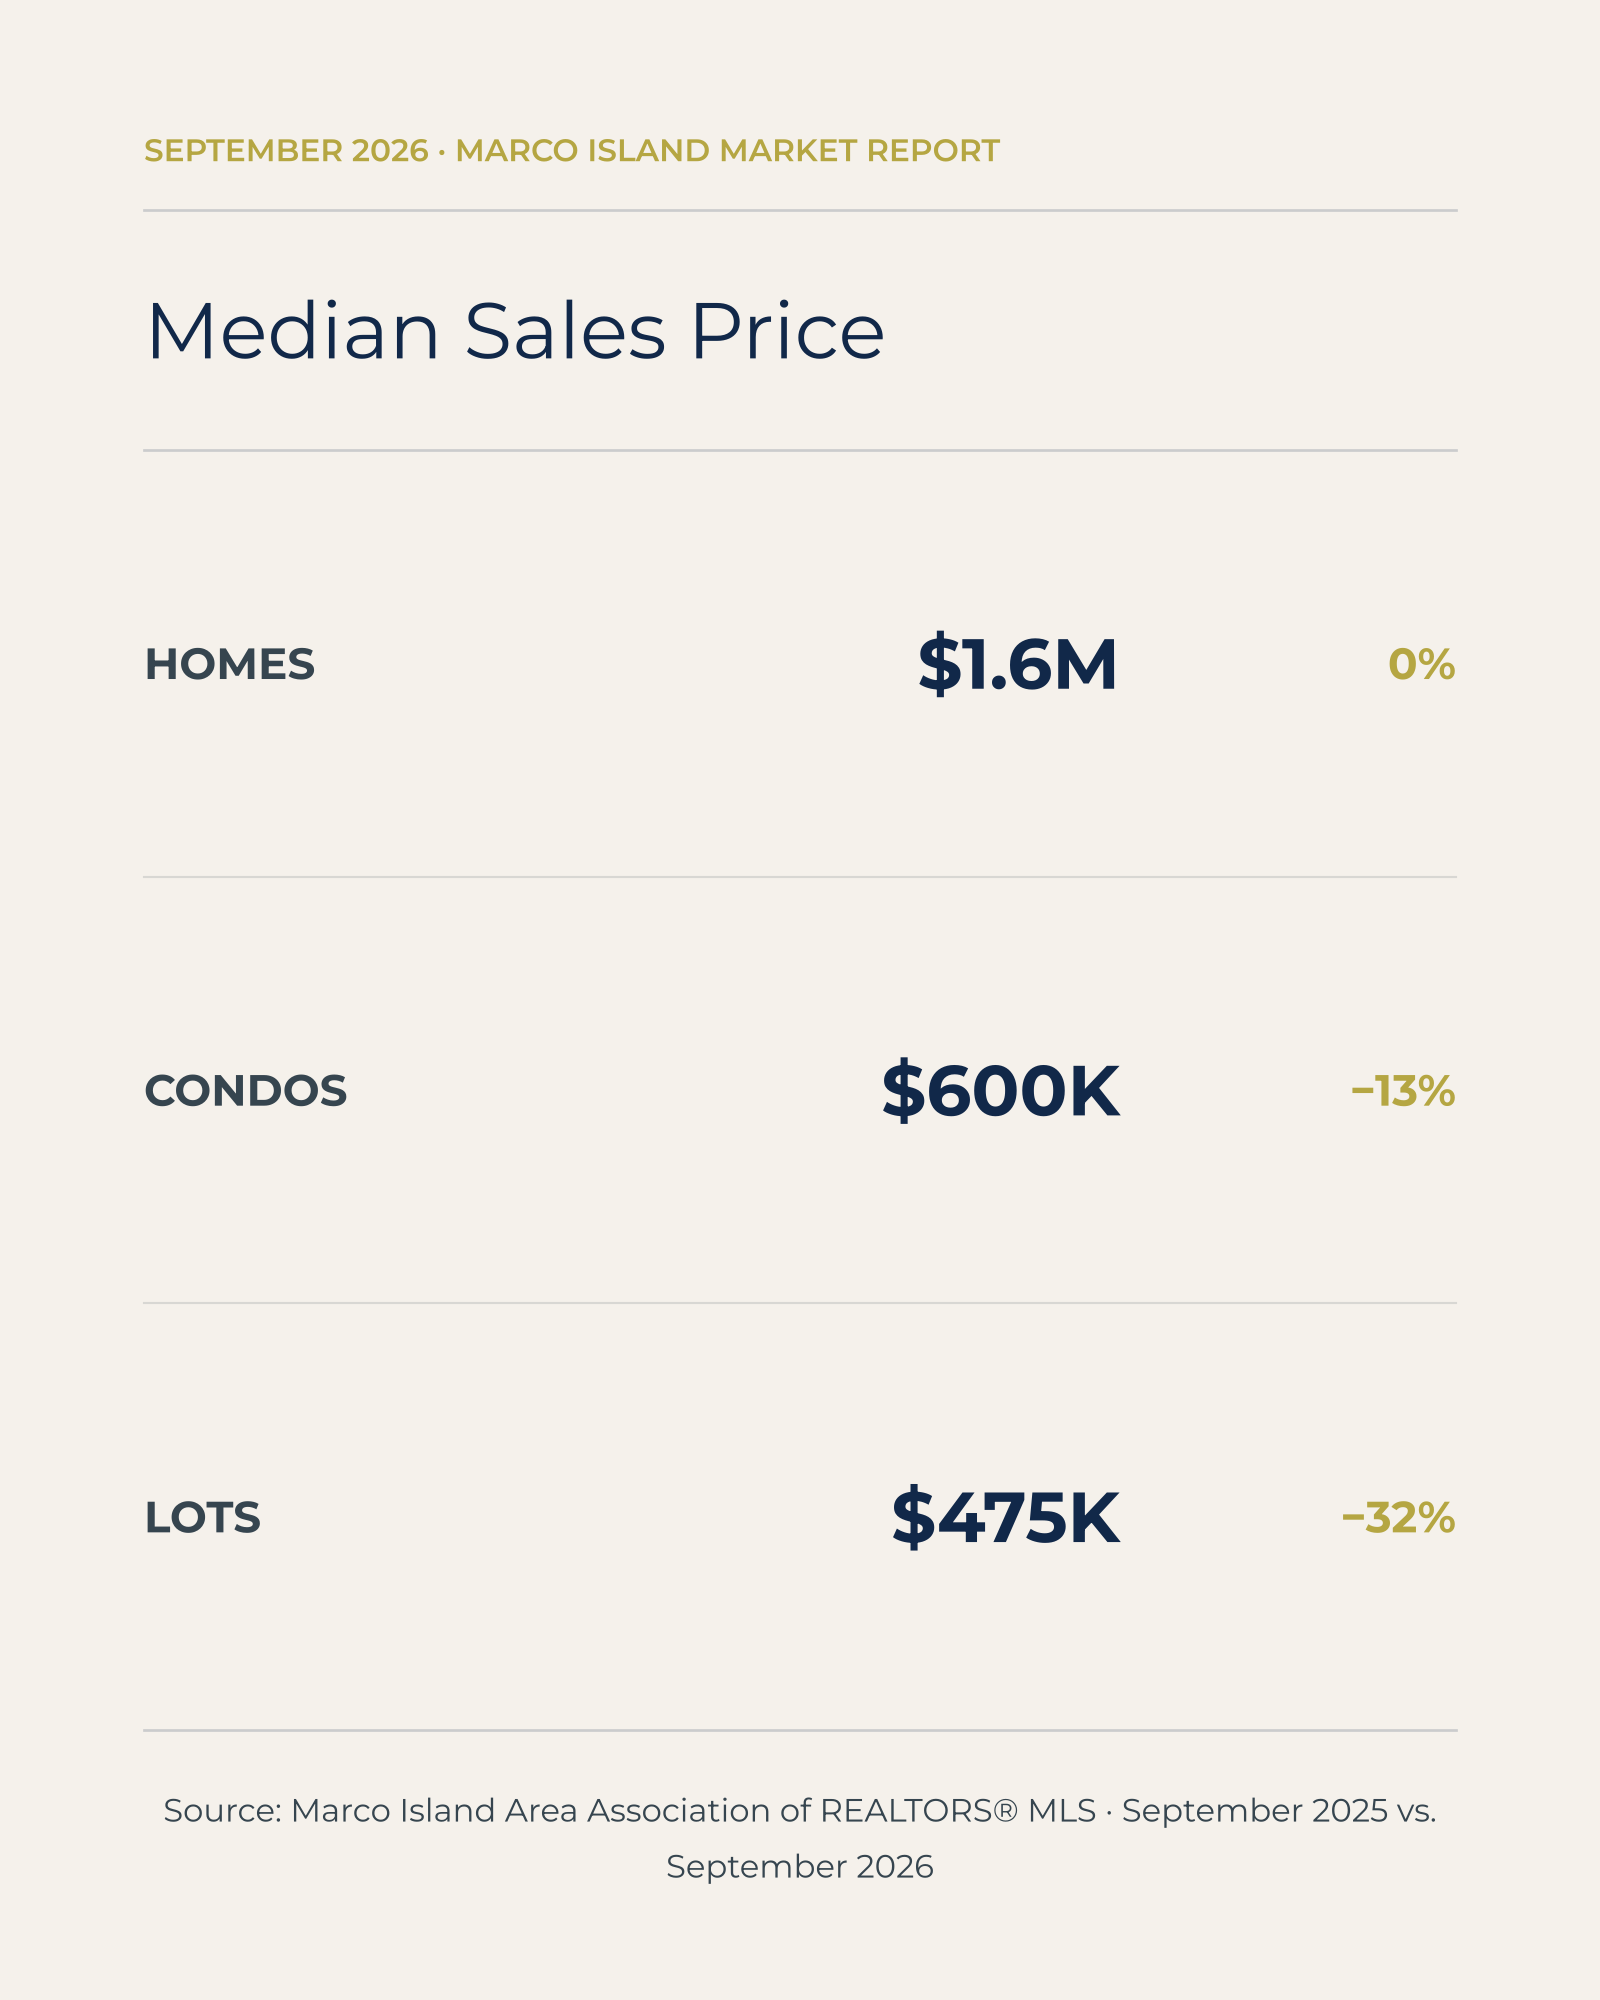
The median sales price for single family homes was $1.6 million, unchanged from the same period last year. Condos had a median sales price of $600,000, down 13%, while lots had a median sales price of $475,000, down 32%.
These differences show why the overall market does not tell the full story. Property type, location, condition, and the mix of properties sold can all affect monthly results.
Time on Market Increases
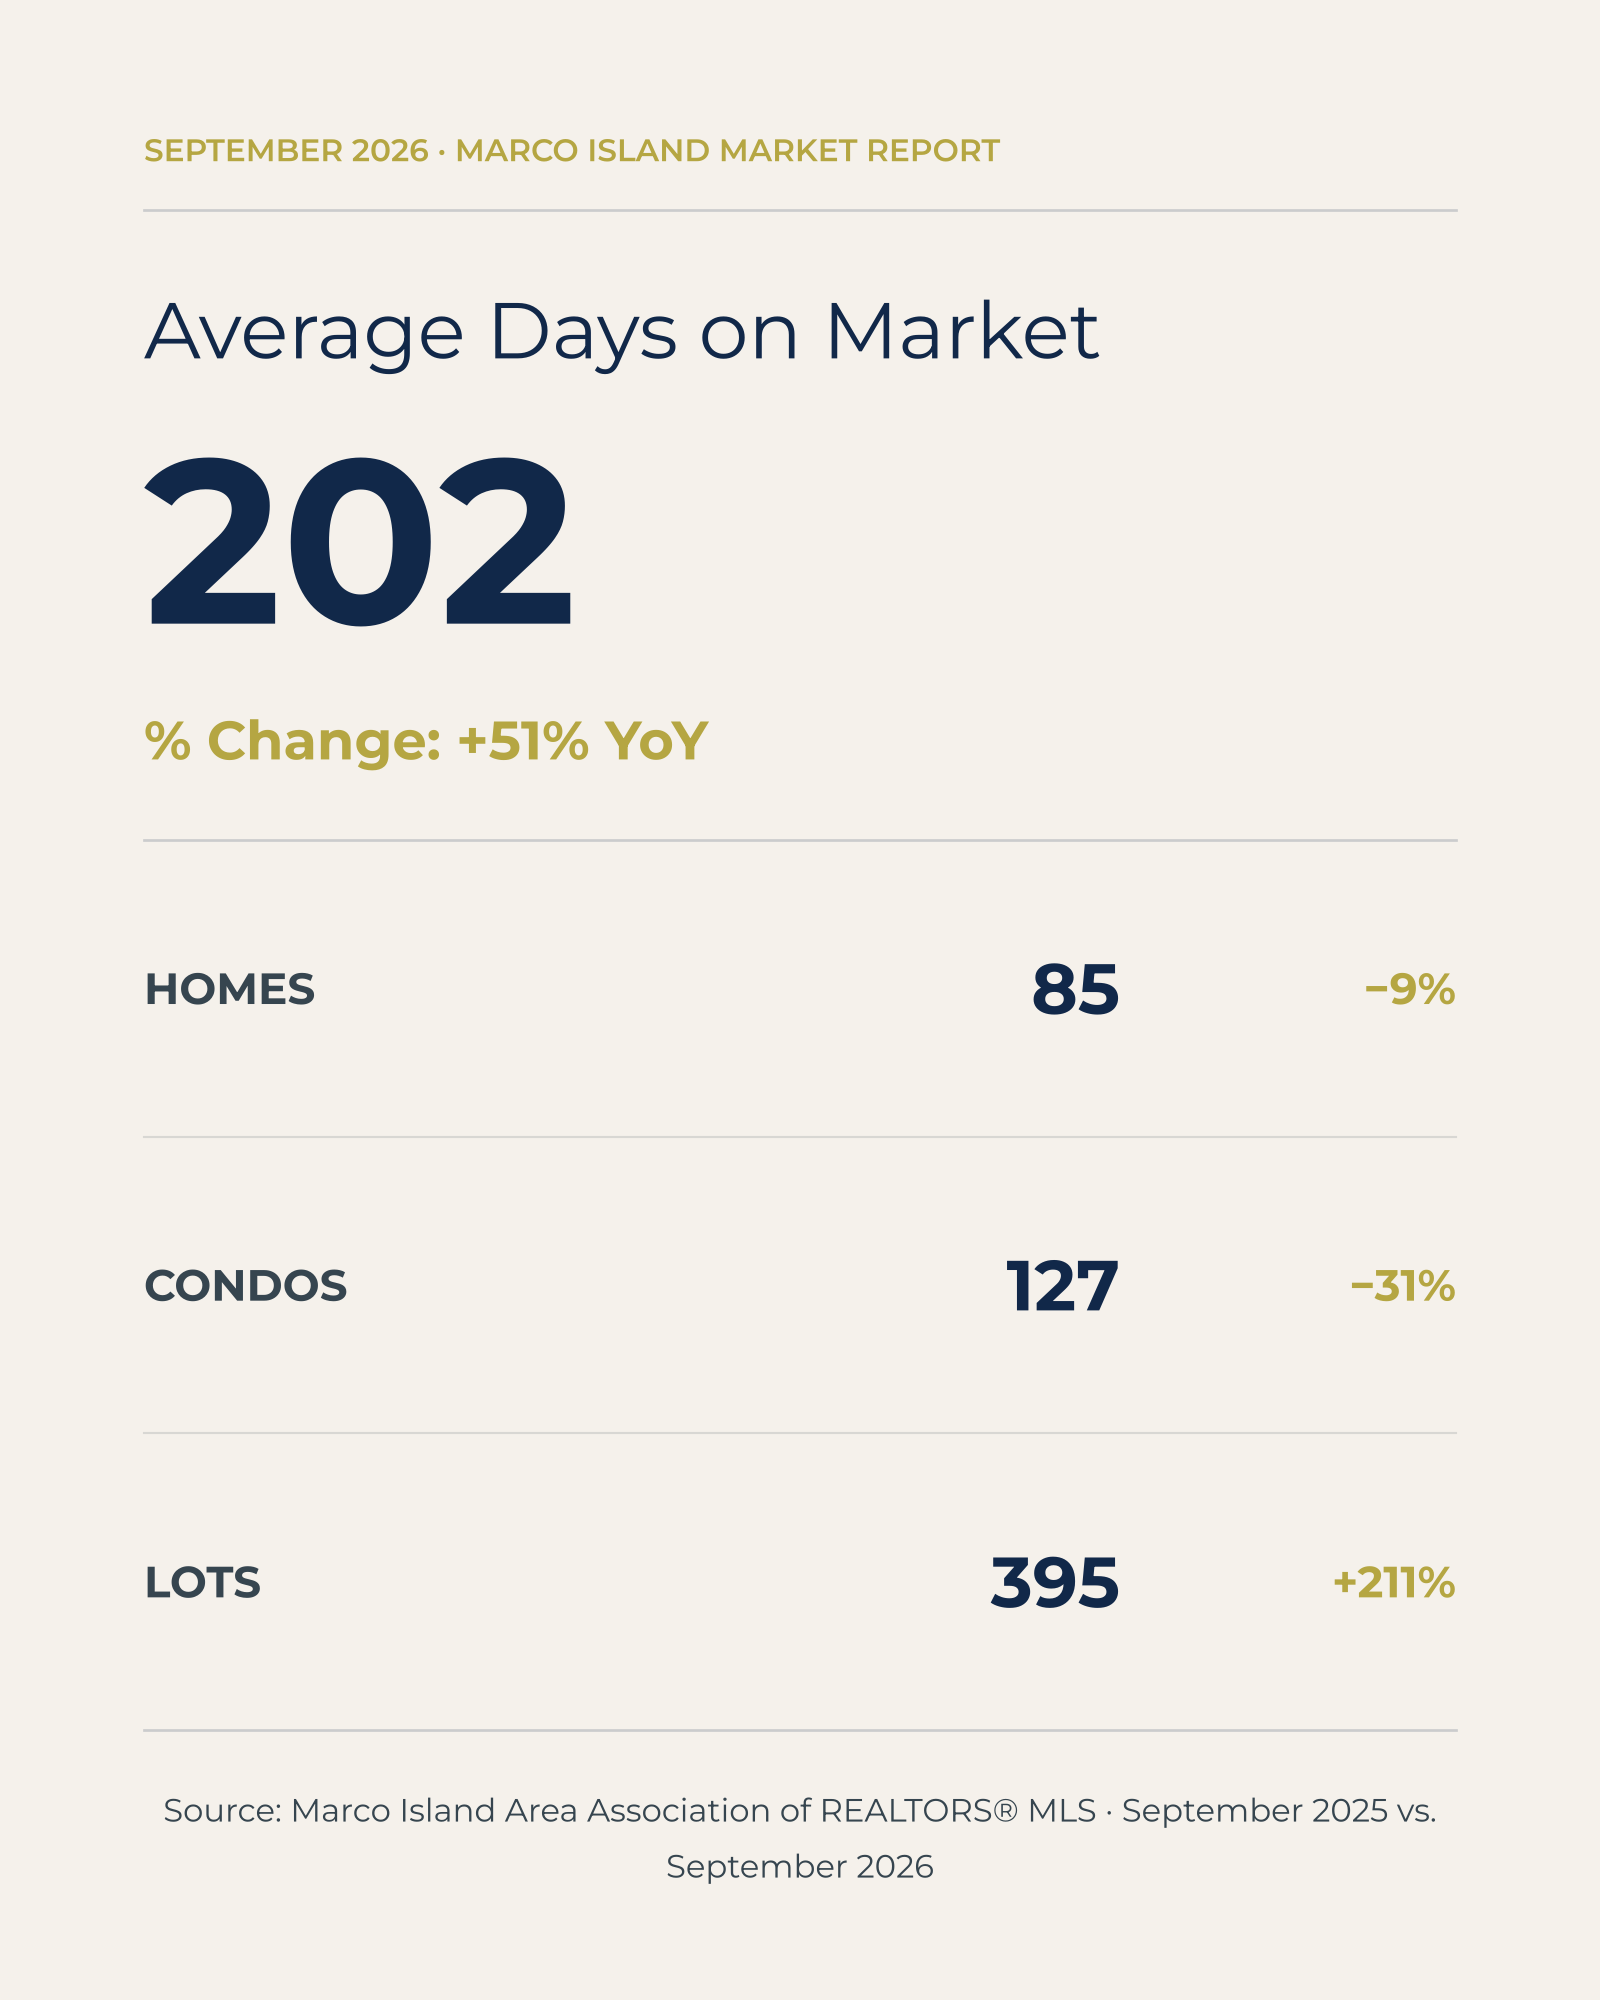
Average days on market rose to 202 days in September, up 51% from September 2025. The overall figure was influenced by different trends across property types.
Homes averaged 85 days on market, down 9%, while condos averaged 127 days, down 31%. Lots averaged 395 days, up 211%.
This contrast suggests that time on market varied considerably by property type. Sellers should consider comparable properties and current competition when setting expectations about how quickly a home may sell.
The Bonnycastle Perspective
September’s figures show a varied Marco Island market. Inventory declined across homes, condos, and lots, while total sales remained unchanged. Condo sales increased, but single family home and lot sales fell. Prices also moved differently across property types.
For buyers, lower inventory means fewer listed options than last year, but the increase in overall days on market may indicate that some properties are taking longer to sell. For sellers, accurate pricing, thoughtful preparation, and a clear understanding of competing listings remain important.
Because Marco Island includes a range of property types and price points, islandwide statistics are best used as a starting point. A property specific review can help buyers and sellers understand how current conditions apply to their own real estate goals.
Data courtesy of the Marco Island Area Association of REALTORS® Multiple Listing Service for September 2025 and September 2026. Property types include Marco Island single family homes, condos, and lots. Percentages and figures are reported as shown in the September 2026 Market Report infographic.
Get Your Home's Value
Curious what your home is worth? Get an instant market-based valuation and a detailed report.
Get Home ValuationQuestions About This Report?
Our market experts are here to help you understand these trends and how they impact your real estate decisions.
Contact Our Team