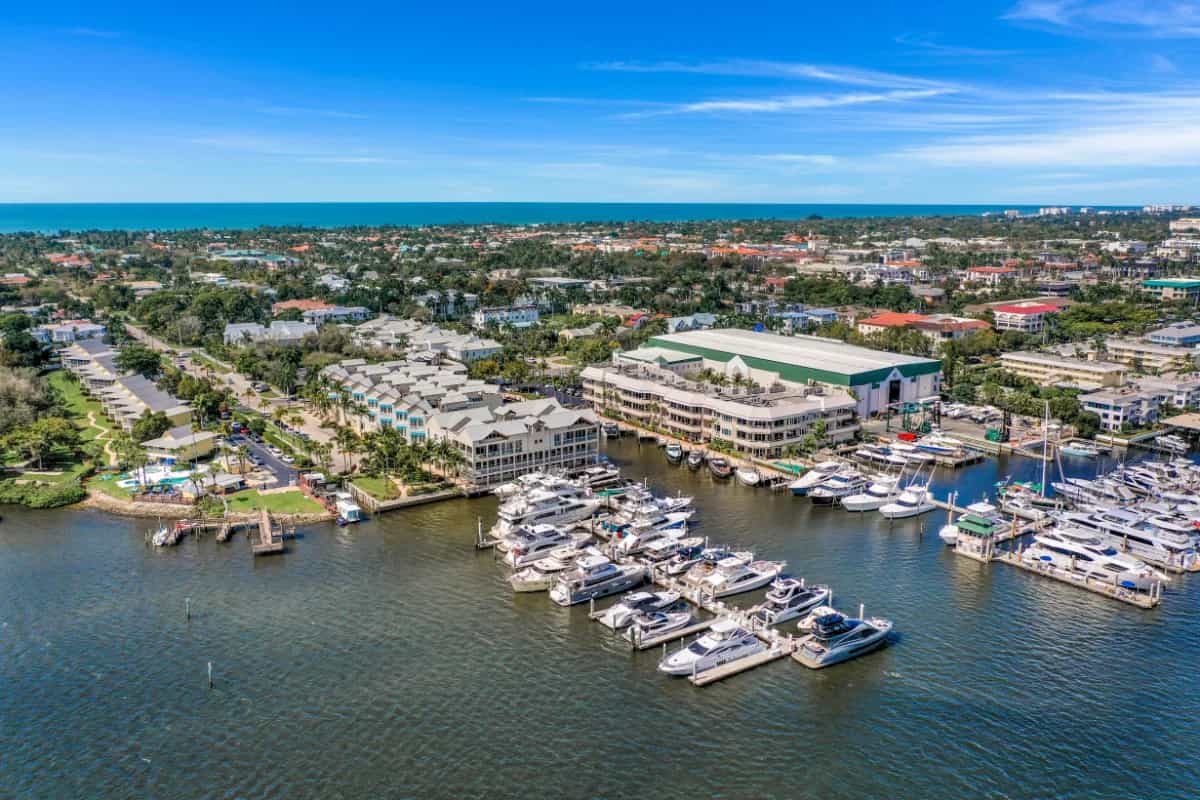
Naples Real Estate Market Report: August 2026
Naples Inventory Declines for Another Summer Month as Buyers Stay Active
Published October 2026
Market Update Video
Listen to this report
Market Analysis
We are back with our latest Naples market report, and the numbers for August 2026 are in. The trend we have been noticing all summer continued: inventory is declining, while buyers remain active. There are fewer homes for sale than a year ago, those homes are selling a little faster, and pricing has held steady through what is usually one of the quietest months of the year.
The figures below come from the August 2026 Market Report from the Naples Area Board of REALTORS (NABOR), which tracks listings and sales across Collier County, excluding Marco Island. Each comparison is August 2026 against August 2025 unless noted otherwise.
New Listings Declined 15.5% in August
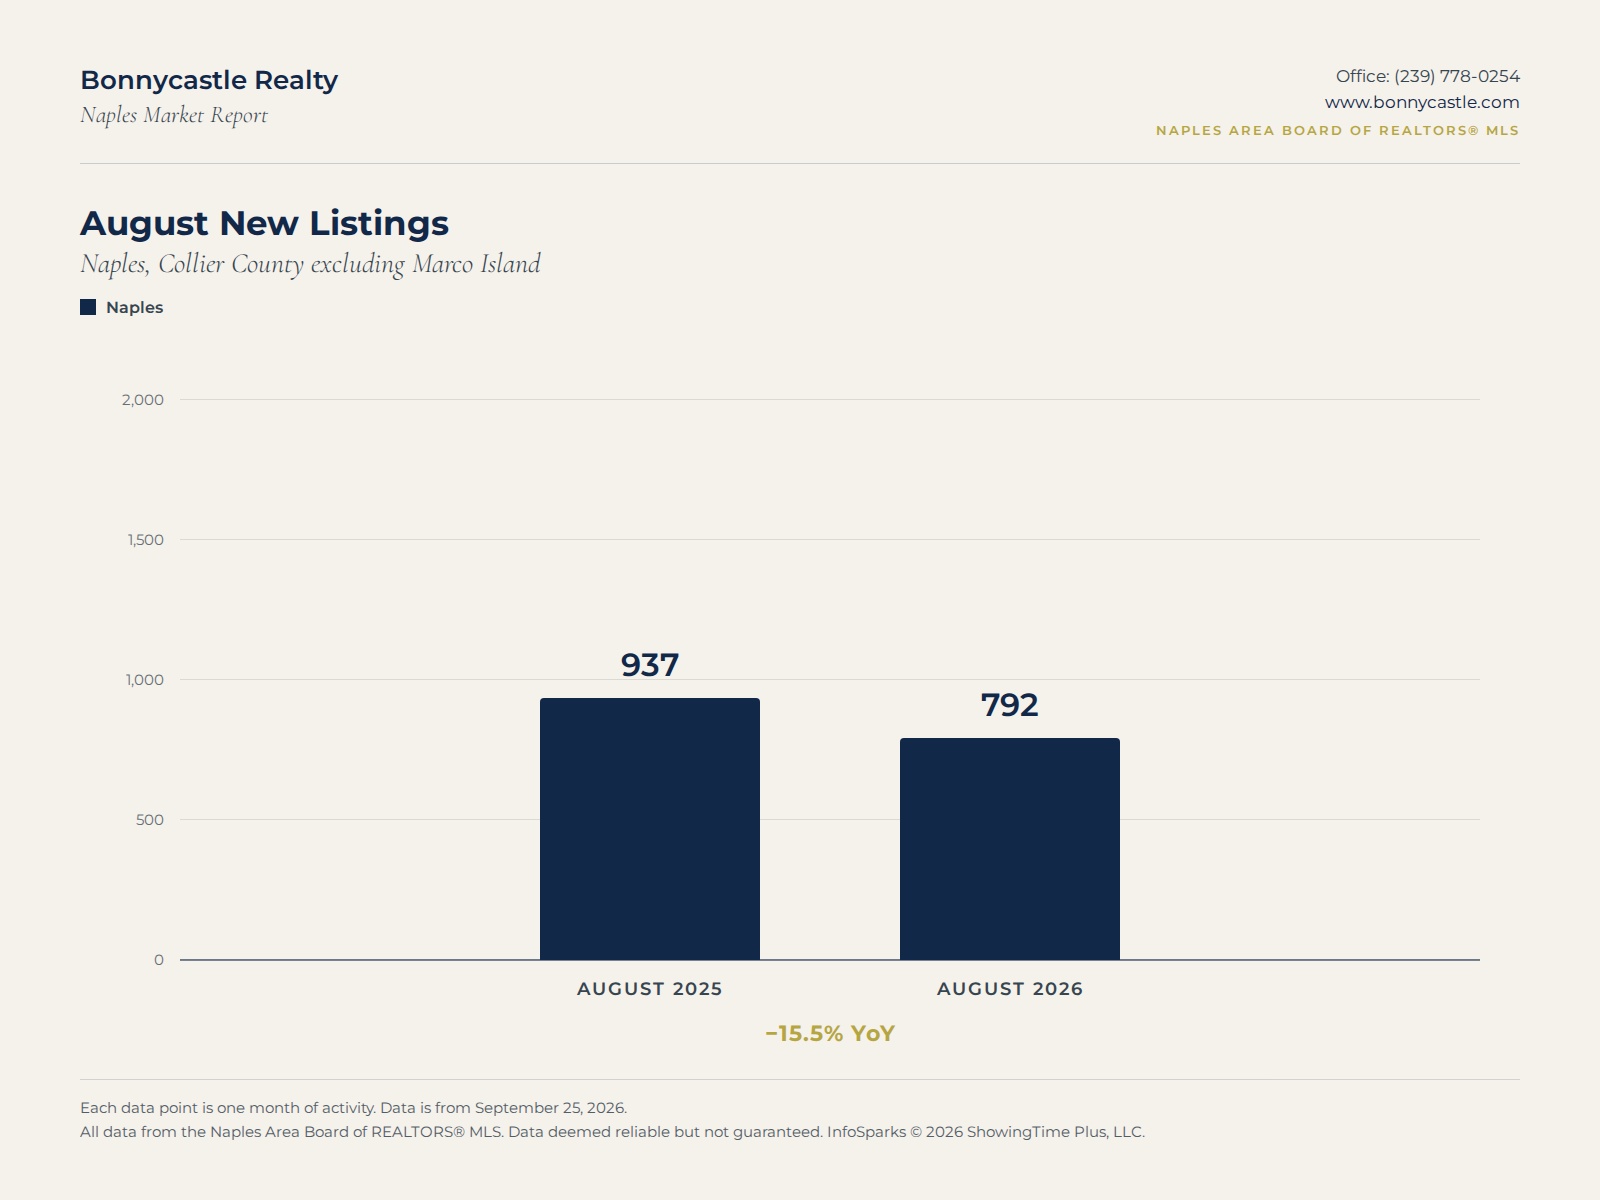
Naples saw 792 new listings in August, down from 937 in August 2025. Year to date, new listings total 9,738, which is 9.7% below the 10,779 recorded through August of last year.
The decline showed up in both segments. Single family new listings fell 13.8% to 432, and condominium new listings fell 17.4% to 360. Fewer owners are bringing residences to market, and it is the main reason inventory has continued to decline, a trend we have been noticing throughout the summer.
Naples Inventory Fell 16% and Months of Supply Dropped to 5.4
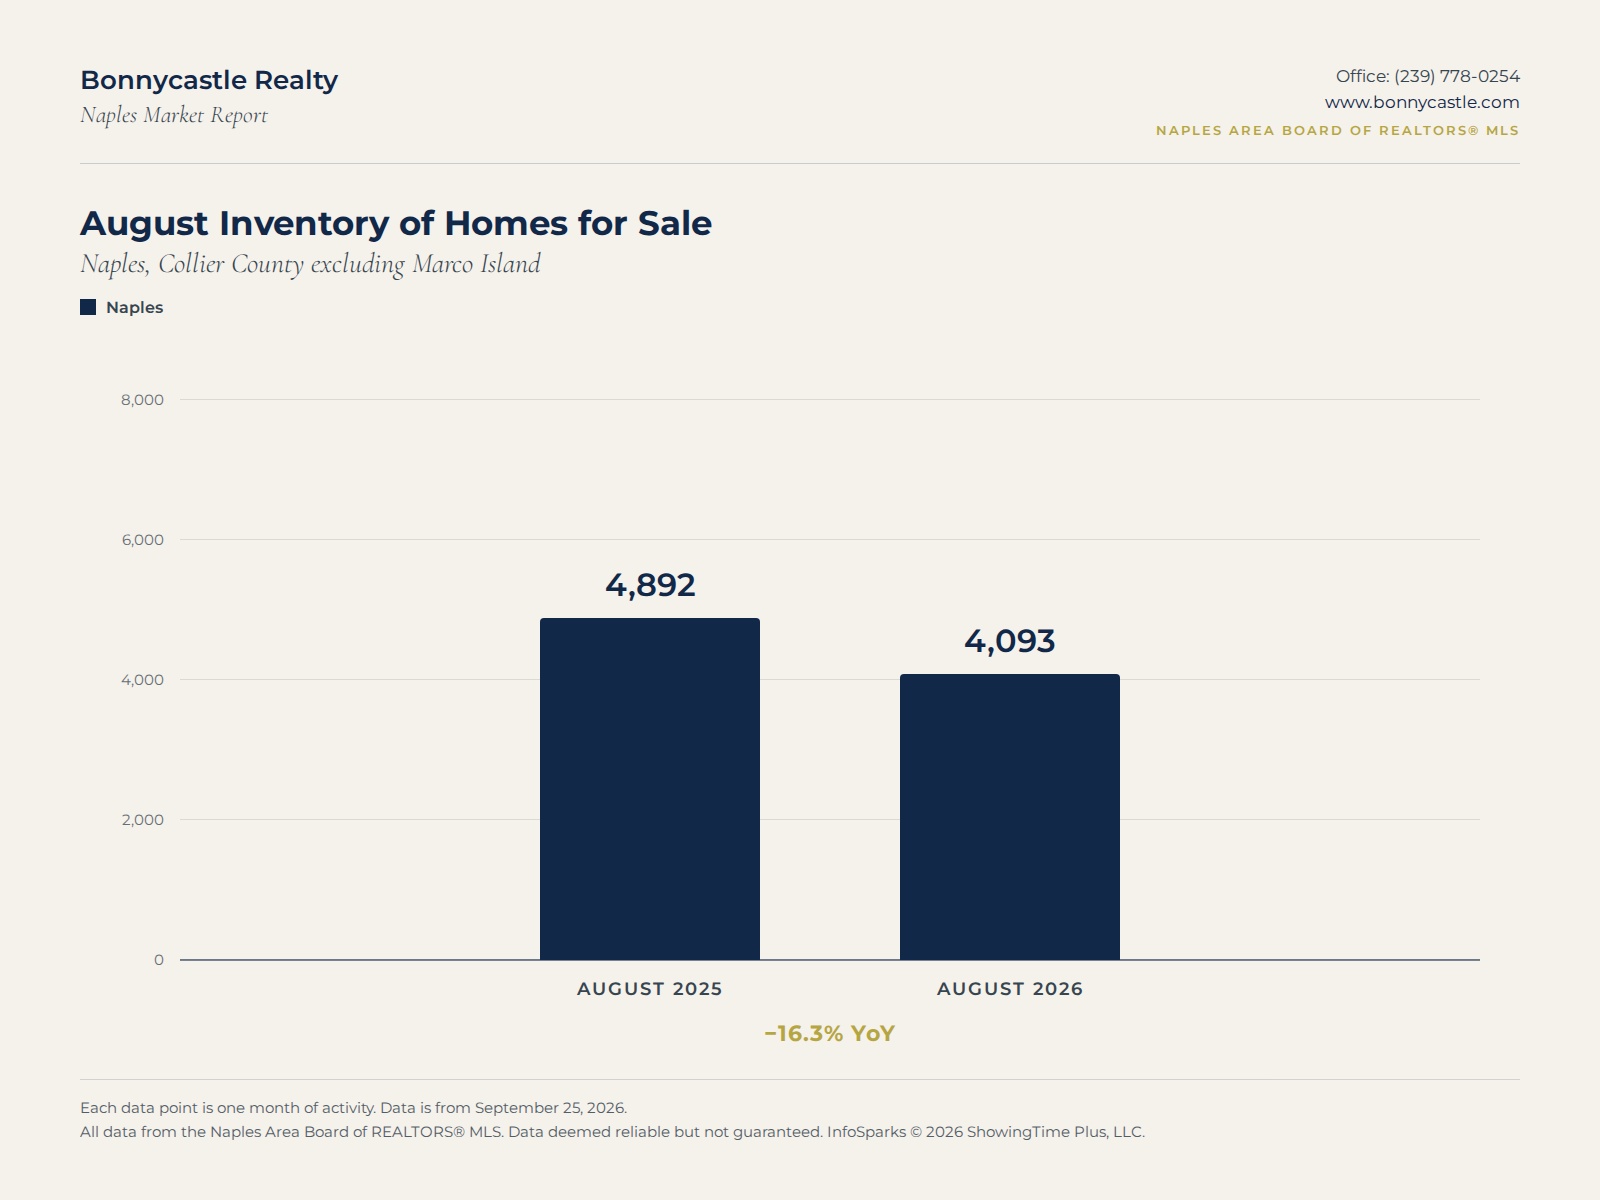
Inventory continued its summer decline. At the end of August, Naples had 4,093 properties available for sale, a 16.3% decline from 4,892 in August 2025. Single family inventory fell 22.5% to 1,994, and condo inventory fell 21.6% to 2,099.
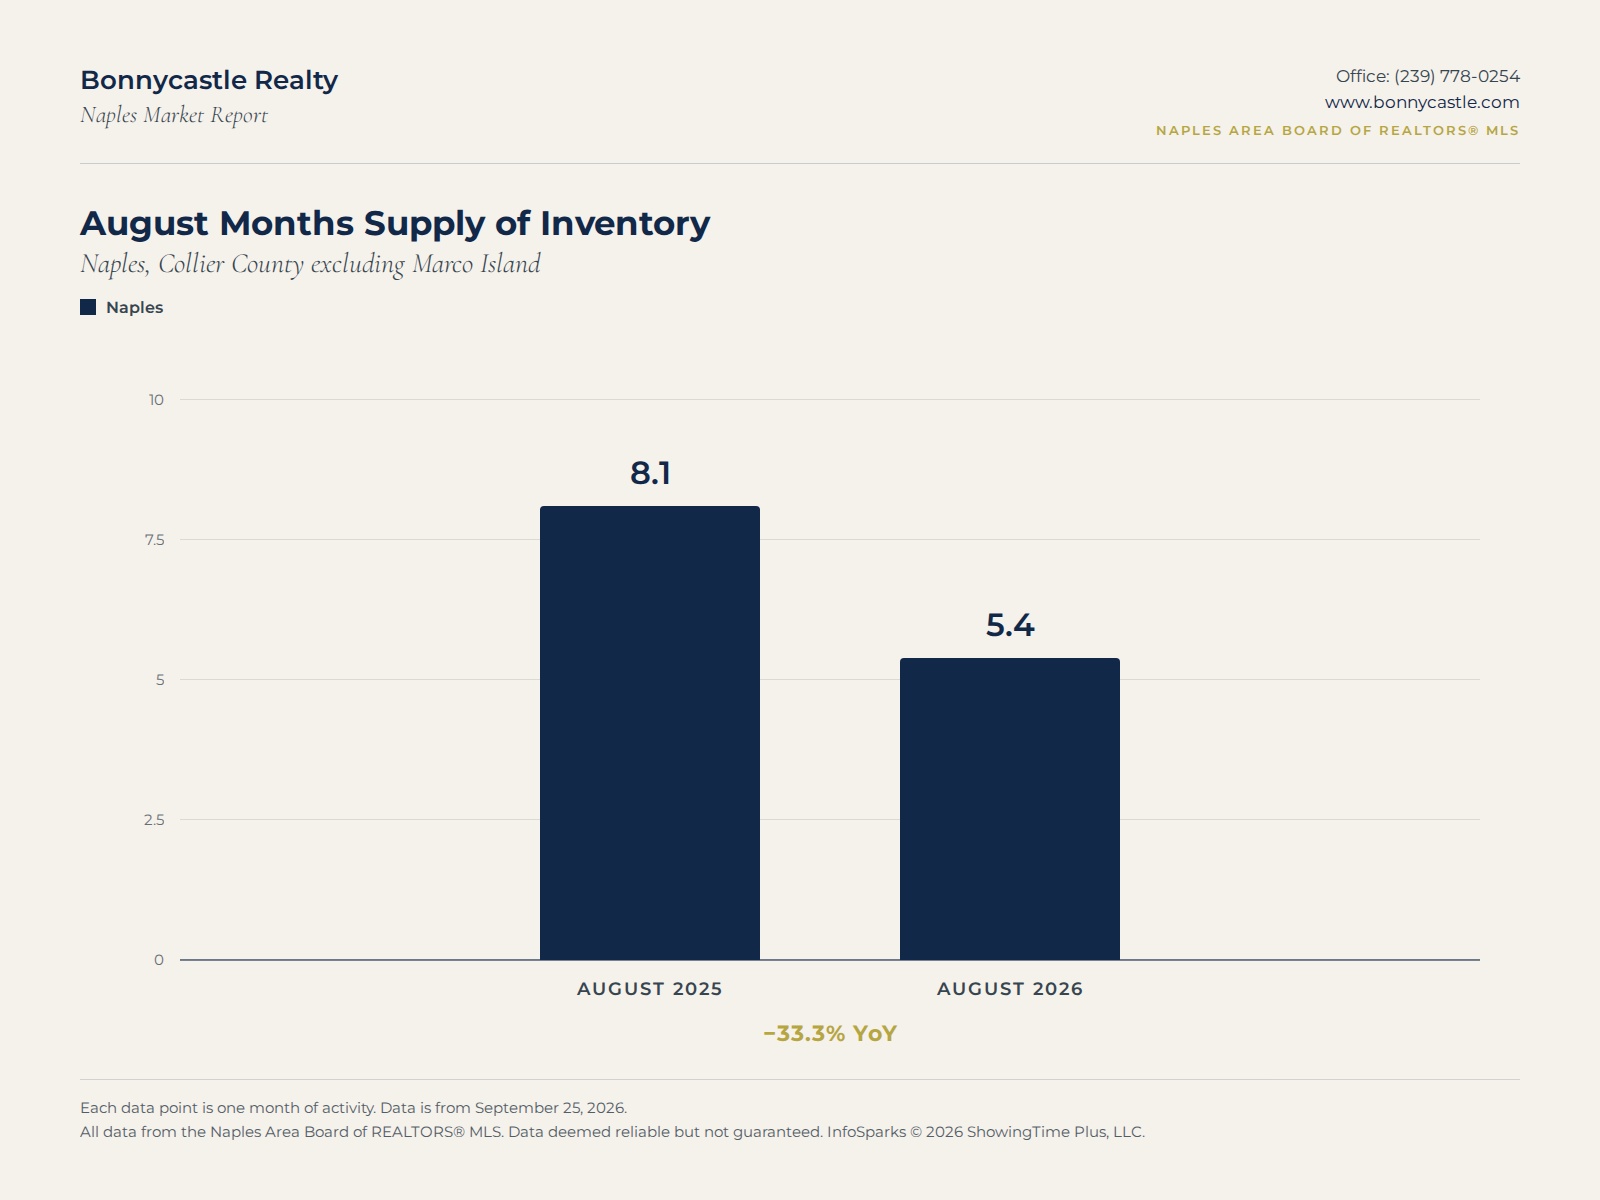
Months of supply tells the same story more clearly. At the current pace of sales, it would take 5.4 months to sell every listing on the market, compared with 8.1 months a year ago. That is a 33.3% drop in a single year.
The tightening is most noticeable at the upper end. Inventory priced between $1.5 million and $5 million fell 30.7% to 651 listings, and listings above $5 million fell 20.5% to 267.
Closed Sales Edged Higher
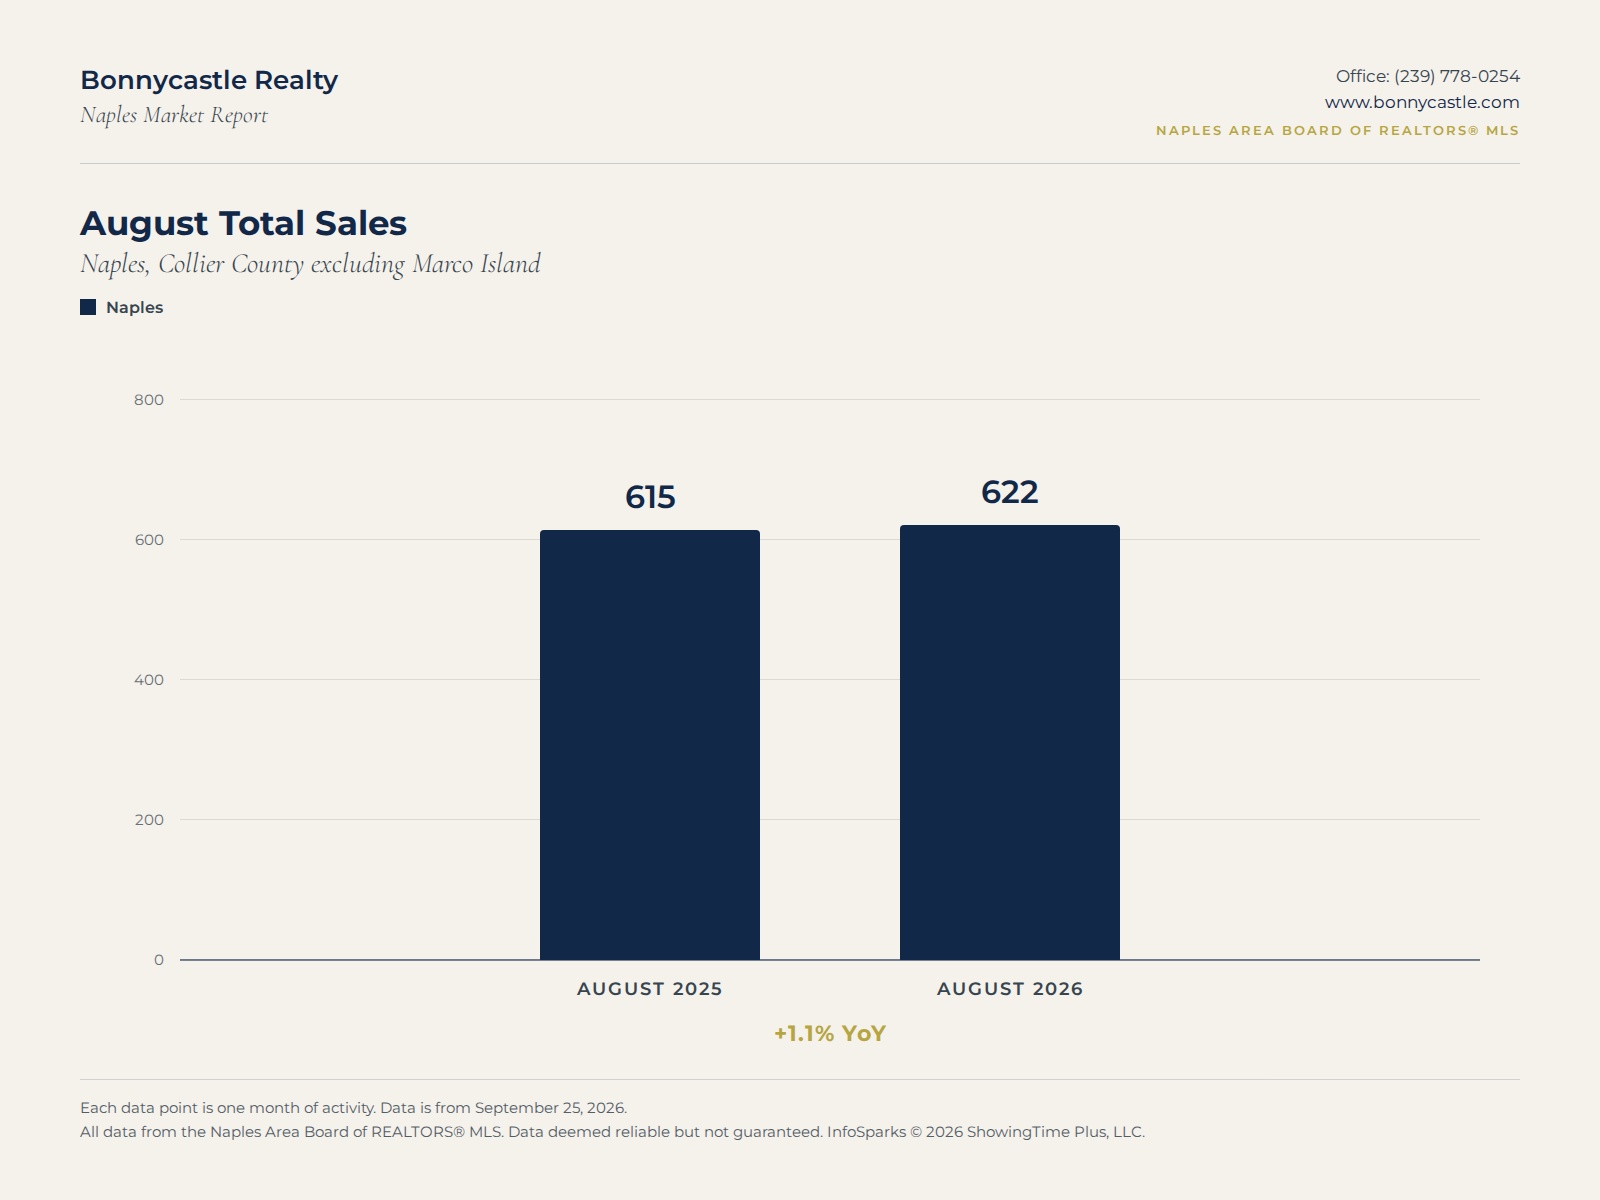
Naples recorded 622 closed sales in August, up 1.1% from 615 in August 2025. Single family closings rose 5.1% to 350, while condo closings slipped 3.5% to 272.
The longer view is stronger, and in line with what we have seen all summer. Year to date, closed sales total 6,612, up 16.2% from 5,690 through August 2025. Over the past 12 months, sales between $1.5 million and $5 million rose 34.2%, and sales above $5 million rose 17.4%.
Pending Sales Continued to Outpace Last Year
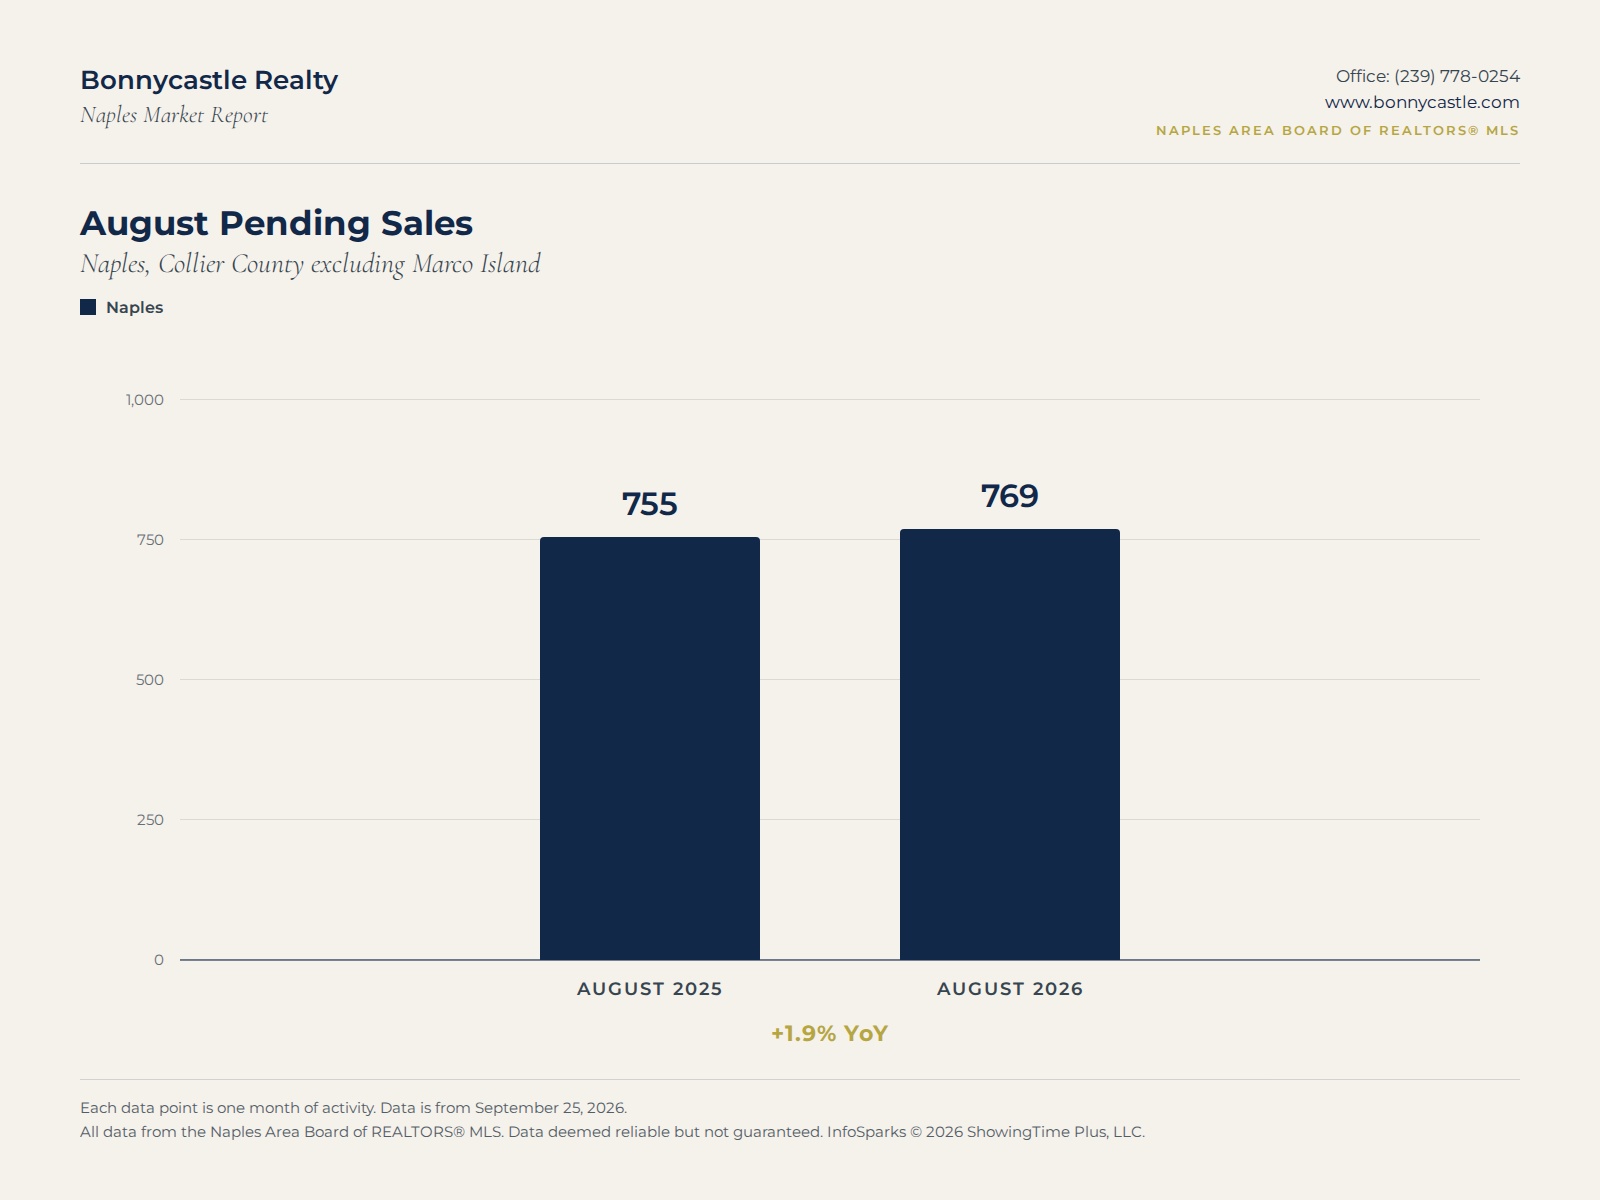
Pending sales saw a modest increase in August, rising 1.9% to 769 from 755 a year ago. Year to date, pending sales are up 21.7%, from 7,075 to 8,613.
Pending sales are a forward indicator, since they reflect contracts that should close in the coming weeks. Steady pending activity through late summer suggests buyer demand is holding, even with higher borrowing costs and broader economic uncertainty.
Median Naples Home Price Held at $575,000
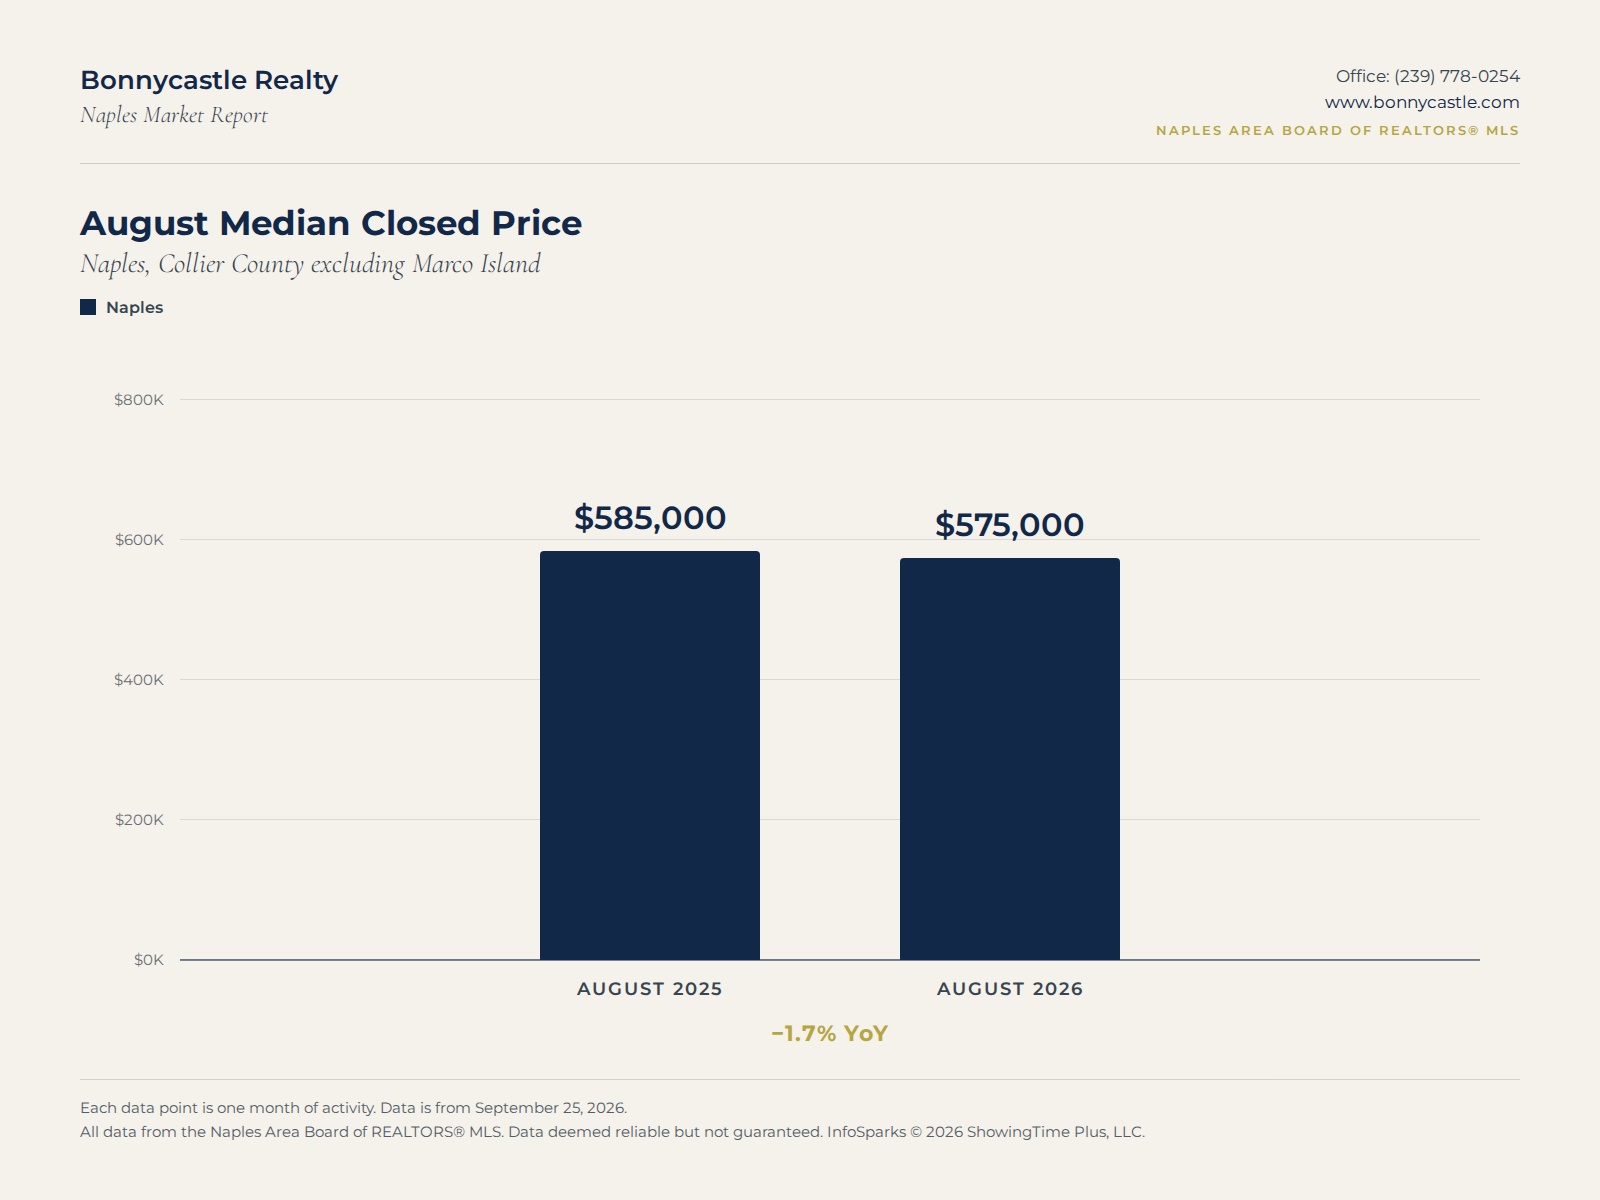
The overall median closed price in August was $575,000, down 1.7% from $585,000 in August 2025. Year to date, the median is $600,000, only 0.8% below last year.
The split between property types matters here. The single family median was $717,500 in August, and the year to date single family median of $765,000 is up 4.1%. The condo median rose 2.7% to $417,500 in August, although the year to date condo median of $440,000 is down 4.3%.
The average closed price rose 8.6% to $1,017,608, which points to more activity at the higher end of the market.
Homes Are Selling Faster
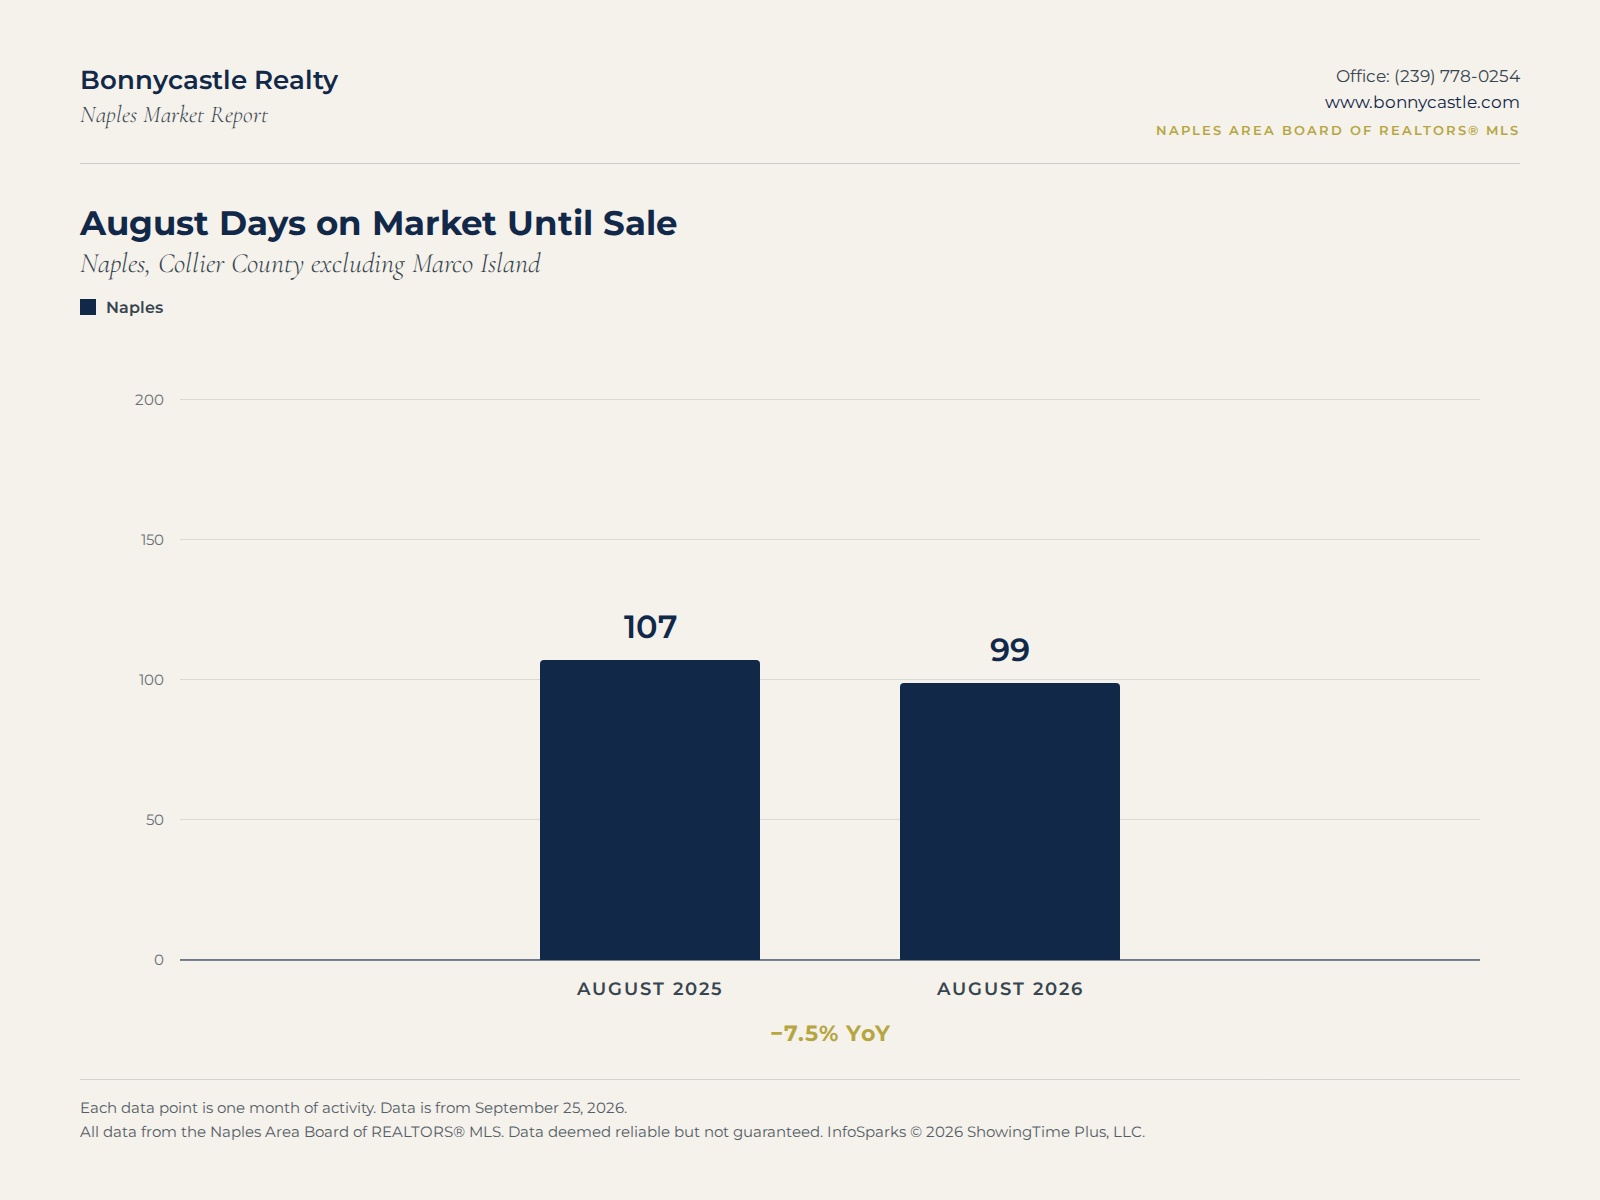
The average home in Naples took 99 days to go under contract in August, down 7.5% from 107 days a year ago. Single family homes averaged 92 days, and condos averaged 109 days, an 11.4% improvement for condos.
Sellers are also getting closer to their asking price. Homes sold for an average of 94.8% of list price in August, up from 93.8% last year.
Price Reductions Fell 30%
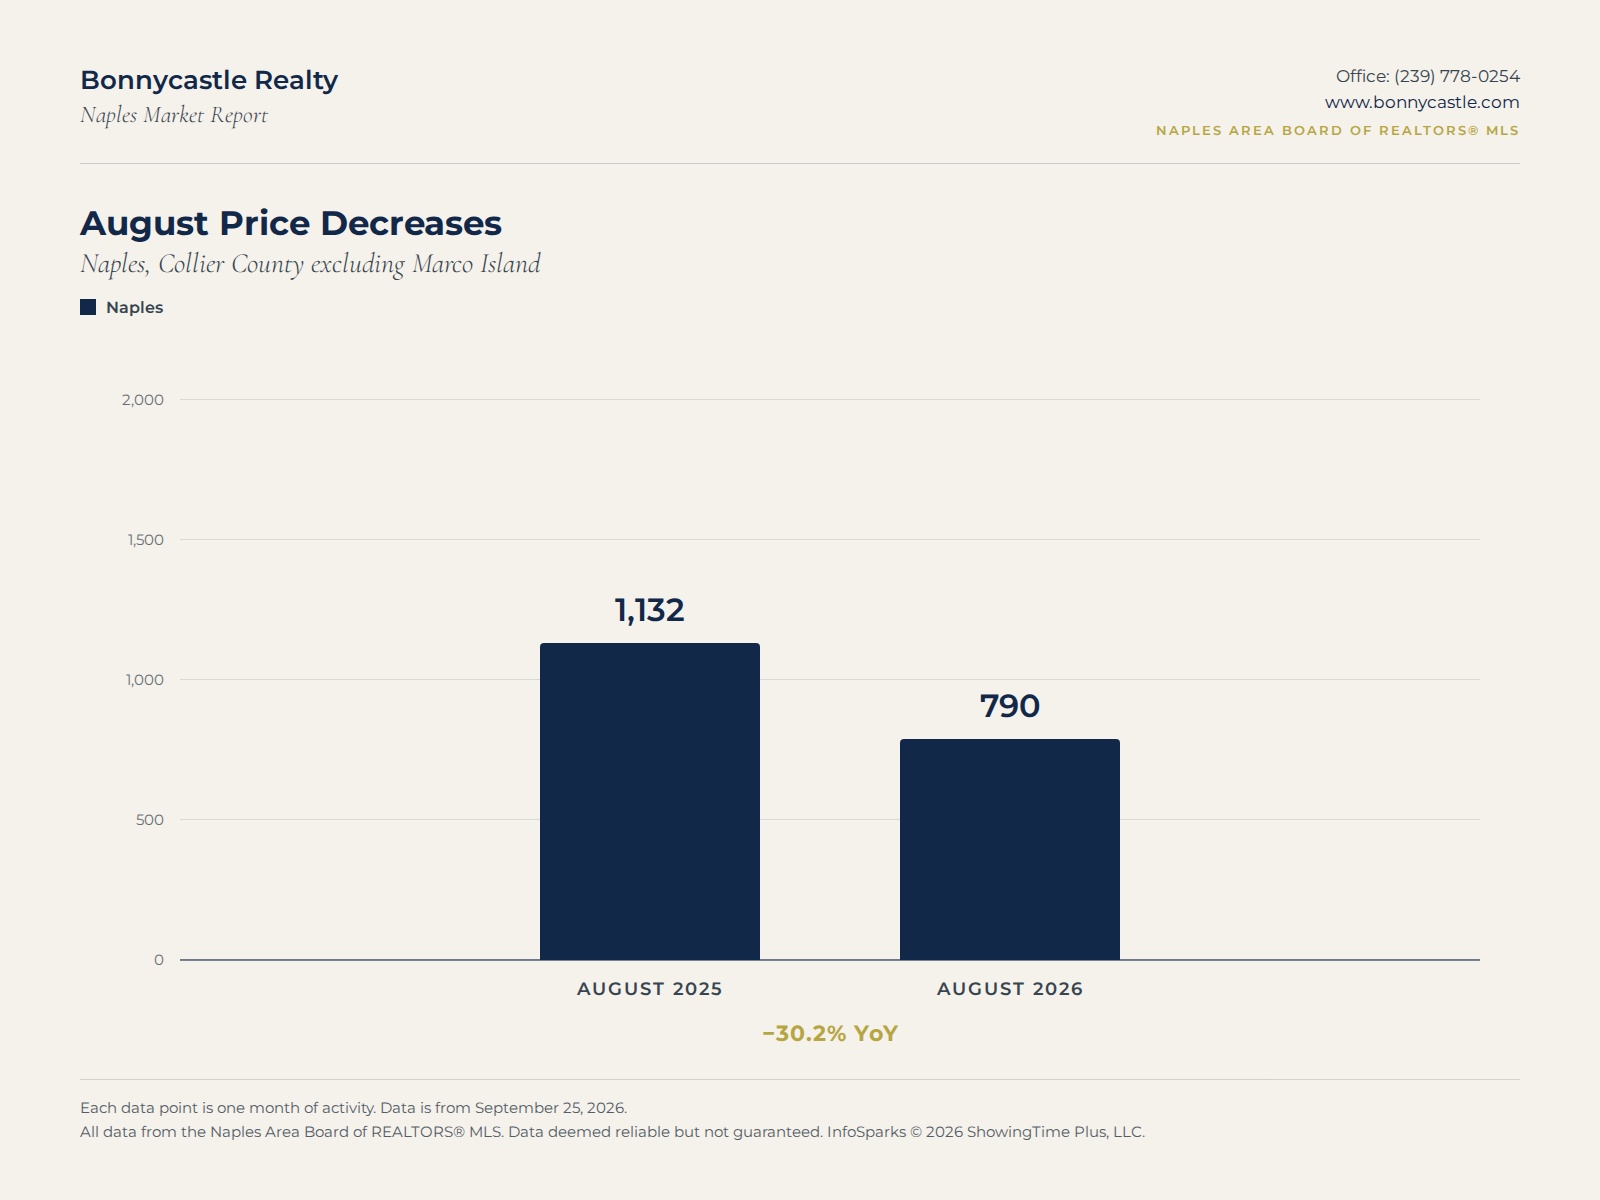
The number of price decreases fell 30.2% to 790, compared with 1,132 in August 2025. Combined with shorter days on market, this suggests more sellers are pricing accurately from the start, and well-priced homes are finding buyers sooner.
What the August Numbers Mean for Naples Buyers
For buyers, August brought both steadiness and a bit more competition. Prices have held within a narrow range all year, so there is little sign of the sharp swings that make planning difficult.
At the same time, choice is narrowing. With inventory down 16% and new listings down 15.5%, the best residences in a given neighborhood or price range may not stay available for long. Homes are selling closer to asking price, and there are fewer price reductions to wait for.
We suggest buyers go into the season with financing in place and a clear sense of what matters most, so they can move with confidence when the right residence appears.
What the August Numbers Mean for Naples Sellers
For homeowners considering a sale, lower inventory means fewer properties competing for the same buyers than there were last summer. Months of supply has dropped from 8.1 to 5.4, and homes are going under contract about a week faster.
The drop in price reductions is the detail we would pay closest attention to. It suggests that accurate pricing from day one is being rewarded, while overpriced listings still sit. Buyers in Naples remain informed and selective, and presentation, condition, and pricing strategy continue to shape the outcome.
Naples Is Moving Toward a More Balanced Market
Taken together, August's numbers do not suggest a market that is overheating or one that is slowing sharply. Sales have risen for 15 consecutive months while inventory and new listings have fallen, and prices have stayed within a narrow range.
A year ago, 8.1 months of supply leaned clearly in buyers' favor. At 5.4 months, Naples is closer to balance, with enough choice for buyers and enough demand for well-prepared sellers.
Real Estate in Naples Is Hyper-Local
Naples-wide statistics are a useful overview, but they do not tell the whole story. August looked quite different from one part of Naples to the next.
Naples Beach (34102, 34103, 34108)
The single family median closed price rose 20.5% to $2,710,250, and single family sales rose 11.1% to 40. Single family inventory fell 28.8% to 351, bringing months of supply down from 12.3 to 7.1. The condo median rose 13.7% to $852,500, and year to date condo sales are up 28.5%.
North Naples (34109, 34110, 34119)
The single family median reached $1,000,000, up 5.3%, and year to date single family sales are up 20.3%. Single family months of supply fell from 6.0 to 3.9, one of the tightest readings in Naples. The condo median was essentially unchanged at $425,000.
Central Naples (34104, 34105, 34116)
Single family homes went under contract in 58 days on average, 25.6% faster than last August, and sold for 95.5% of list price. The single family median rose 5.0% to $650,000, and months of supply fell to 3.9.
South Naples (34112, 34113)
Single family sales rose 35.3% to 46, and days on market fell 27.9% to 80. The single family median eased 4.9% to $680,000, while the condo median rose 26.7% to $380,000.
East Naples (34114, 34117, 34120, 34137)
Single family homes sold for 96.5% of list price on average, the strongest figure of any area in the report. The single family median was $625,000, and year to date condo sales are up 38.6%.
Because conditions vary this much by zip code and property type, we look at each neighborhood on its own before advising on price or timing.
Questions About This Report?
If you would like to dive into your hyper-local market, we are happy to walk you through what these numbers mean for your neighborhood and your plans. Send us a message whenever you are ready.
Download Full Report
Get the complete market analysis including detailed charts, data tables, and additional insights.
Download PDF ReportGet Your Home's Value
Curious what your home is worth? Get an instant market-based valuation and a detailed report.
Get Home ValuationQuestions About This Report?
Our market experts are here to help you understand these trends and how they impact your real estate decisions.
Contact Our Team