Naples Real Estate Market Report: June 2026
Closed Sales Hit a Five-Year June High as Inventory Falls 23 Percent — What It Means for Buyers and Sellers in Collier County
Published July 2026
Listen to this report
Market Analysis
June is usually when Naples exhales. Season has wound down, the snowbirds have gone home, and the pace around town slows. This year the numbers tell a different story: sustained demand, tightening supply, and a market that continues to outperform expectations heading into the back half of 2026.
A Five-Year High for Closed Sales
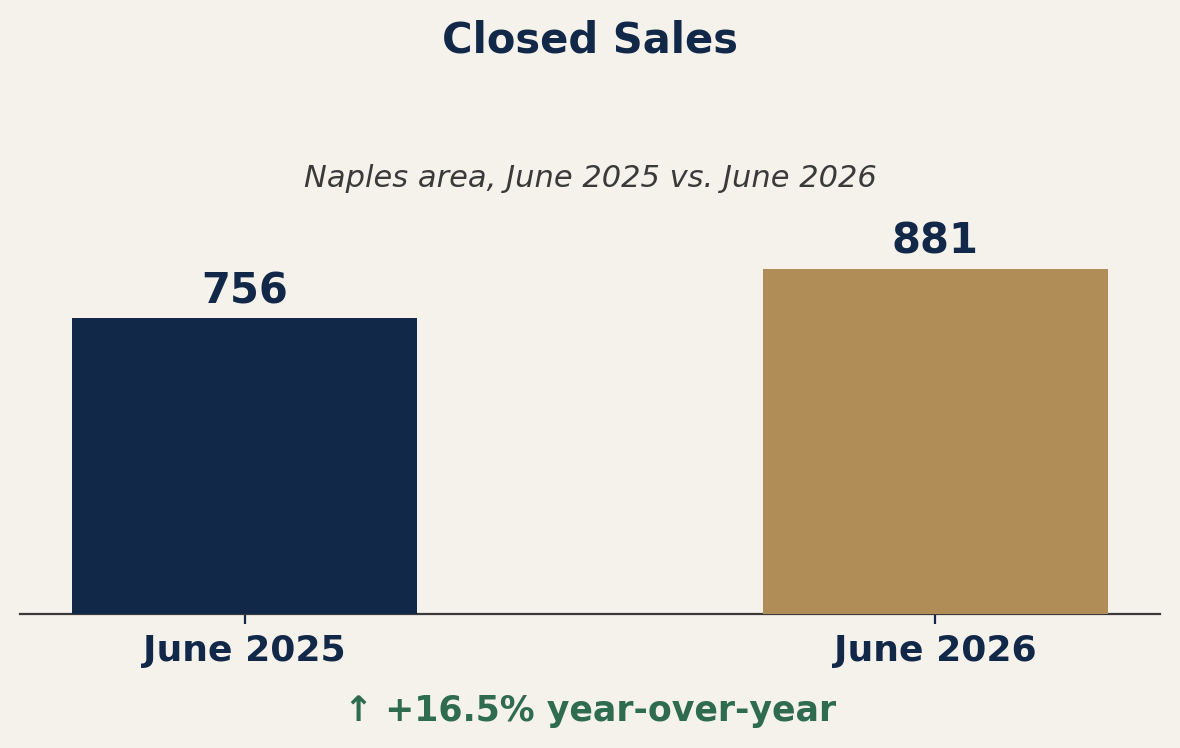
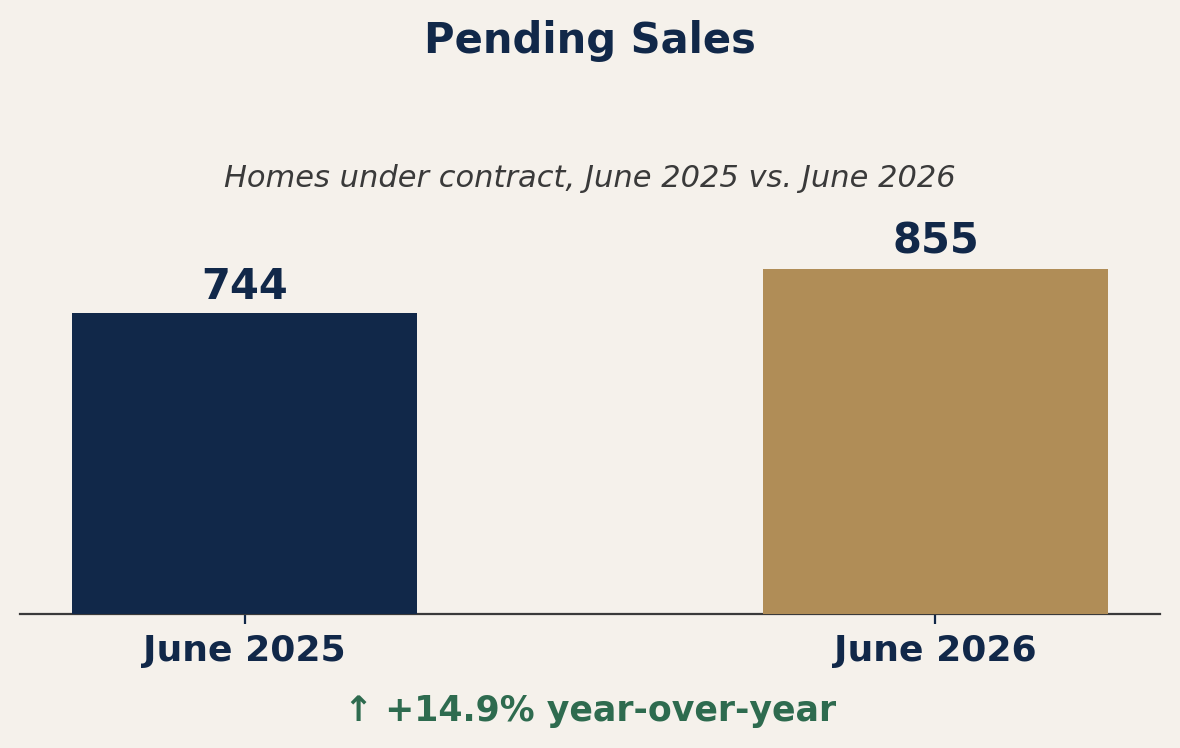
Closed sales in the Naples area rose 16.5 percent in June, climbing to 881 from 756 a year earlier, marking one of the strongest June performances the market has seen in five years. Pending sales, homes going under contract, followed the same pattern, up 14.9 percent to 855 from 744.
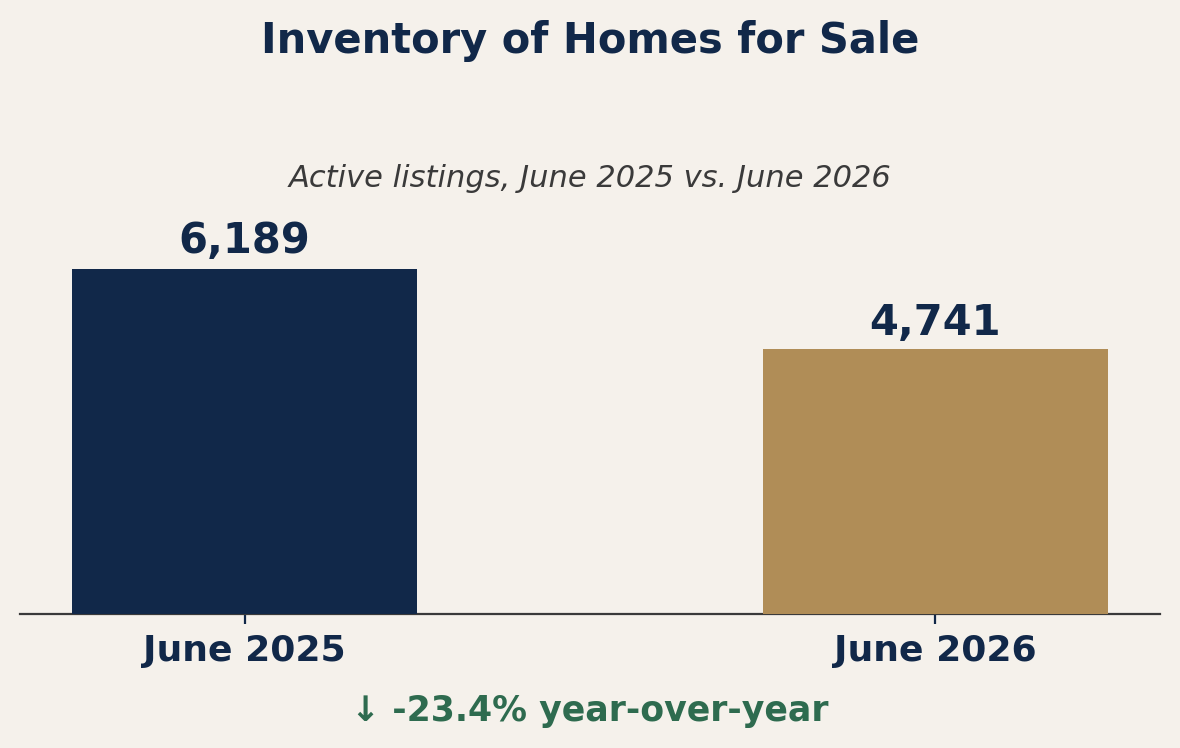
At the same time, inventory continues to tighten. Active listings fell 23.4 percent to 4,741 homes from 6,189, pulling months of supply down 35.1 percent to 6.3 months from 9.7. Part of the decline traces back to fewer new listings hitting the market, down 9.6 percent in June and 11.4 percent year-to-date. Fewer homes are coming on, and more of what is on the market is finding a buyer.
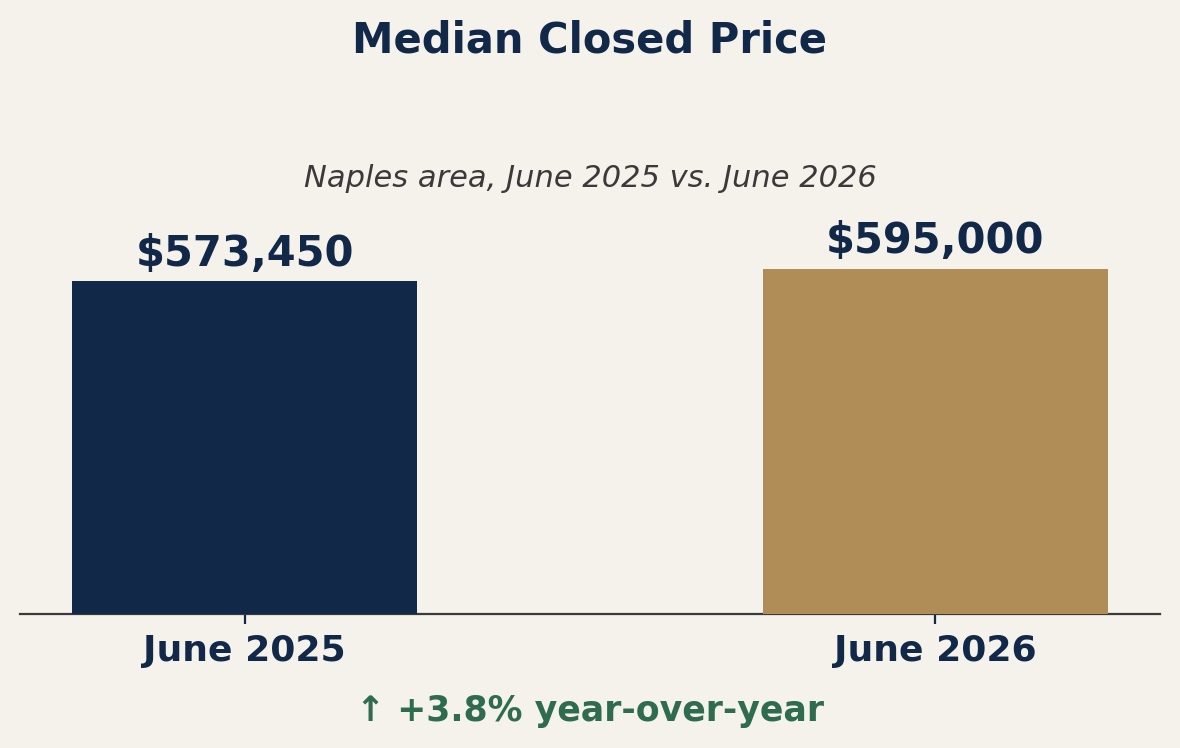
The overall median closed price rose 3.8 percent to $595,000 from $573,450. Year-to-date, the median sits at $610,000, down slightly, 0.8 percent, from $615,000 over the same period last year, a reminder that a strong month does not erase the push and pull happening underneath it.
A Hyper-Local Market
As always, the Naples-wide numbers only tell part of the story. Beneath them sits a collection of micro-markets, each moving at its own pace.
North Naples and South Naples led the single-family gains in June, with closed sales up 22.8 percent and 28.9 percent respectively. Central Naples was more measured, up 9.3 percent, while East Naples held essentially flat, up 1.3 percent, a sign that pockets of the market are still working through more available supply than others. Naples Beach single-family sales inched up 3.9 percent, though pricing there remains highly sensitive to the handful of ultra-luxury transactions that close in any given month.
Whether you are buying or selling, the dynamics of your specific community, not the county-wide average, should be driving your strategy.
Condos Are Making Moves
Condominiums outpaced single-family homes across nearly every community in June. South Naples condo closings jumped 43.8 percent, Naples Beach was up 36.5 percent, and Central Naples rose 33.3 percent. Naples-wide, condo closed sales climbed 27.7 percent compared to 7.8 percent for single-family homes.
Pricing tells a more nuanced story. The overall single-family median closed price rose 7.1 percent to $750,000, while the condo median eased 1.7 percent to $442,500. Buyers are moving on condos in volume, but the price growth we are seeing this cycle is concentrated in single-family residences.
Where the Strength Is Concentrated
Broker analysts reviewing the report point to real momentum in the luxury tier. Over the past 12 months, closed sales between $1.5 million and $5 million are up 29.4 percent, and sales above $5 million are up 11.5 percent. Entry-level activity is moving as well, with sales at $300,000 and below up 39.7 percent, while the broad middle of the market, $500,000 to $1.5 million, grew a steadier 10.5 percent.
The Pace of a Transaction
Days on market rose 5.1 percent to 103 days in June, and 10.2 percent to 97 days year-to-date, evidence that buyers are active but deliberate. Meanwhile, the percentage of list price received held essentially steady at 94.5 percent, up 0.4 percent from last June. Homes priced to the market continue to move; those that are not are the ones adding to the days-on-market average.
Looking Ahead
Broker analysts reviewing NABOR®'s June 2026 report agree that the Naples area housing market enters the second half of the year with momentum firmly on its side: steady buyer demand, inventory that still offers buyers real choice, and sellers who continue to price with more discipline than in years past.
But the through-line remains the same one we return to every month: this is a hyper-local market. County-wide statistics tell an important part of the story, but understanding how your specific community fits within that larger picture is what actually informs a good decision.
If you'd like to understand your hyper-local market, let's talk.
Download Full Report
Get the complete market analysis including detailed charts, data tables, and additional insights.
Download PDF ReportGet Your Home's Value
Curious what your home is worth? Get an instant market-based valuation and a detailed report.
Get Home ValuationQuestions About This Report?
Our market experts are here to help you understand these trends and how they impact your real estate decisions.
Contact Our Team