Heritage Palms Golf & Country Club
~$300k – $1.1M+
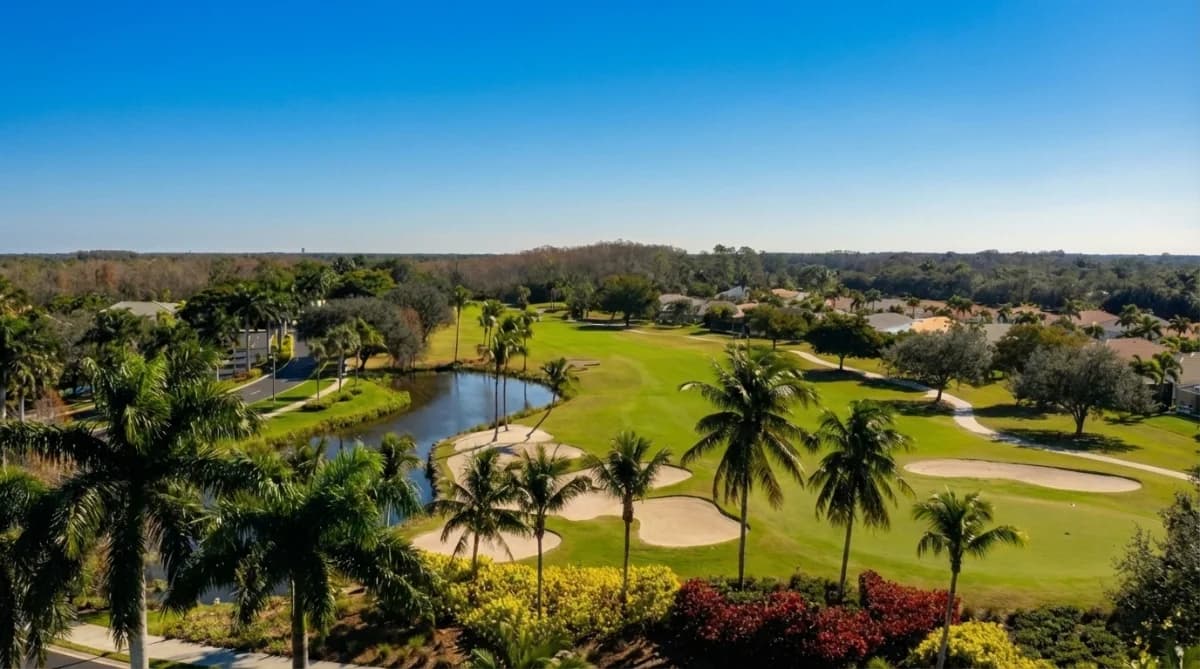
Heritage Palms Golf & Country Club is a private bundled golf community in Fort Myers, Florida. The community spans more than 800 acres, with 45 freshwater lakes and ponds and 179 acres of nature preserves woven around homes, golf, and amenities.
Residents enjoy 36 holes of championship golf across two courses designed by Jed Azinger and Gordon Lewis, along with world-class practice facilities including a driving range and multiple putting greens. Membership and golf privileges are bundled with every home purchase, creating a truly golf-centric neighborhood.
Golf & practice facilities
Heritage Palms features two 18-hole, par 72 layouts, the Royal and the Sabal, each offering multiple tee boxes and distinct shot values. The driving range and practice greens support warmups, game improvement, and instruction throughout the season.
Amenities & club life
Beyond golf, residents enjoy 8 lighted Har-Tru tennis courts, pickleball courts, bocce courts, a fully equipped fitness center, and a resort-style pool with poolside Tiki Bar and Grill. The main clubhouse and Grill Room provide additional dining options, social spaces, and event venues.
With 1,662 properties and 1,600 bundled golf memberships, Heritage Palms combines the scale of a full-service resort club with the feel of a cohesive, active community in Fort Myers.
Quick Facts
- Home Prices
- ~$300k – $1.1M+
- Monthly Fees
- Club golf dues currently ≈$660/mo; total carrying costs vary by neighborhood and HOA.
- Initiation Fee
- Bundled with ownership (no separate club initiation fee; other one-time/HOA fees vary by neighborhood).
- Residences
- Approx. 1,662 properties
- Location
- Fort Myers, Florida
- Established
- 1998
- Lifestyle
- Two-course bundled golf community with lakes, preserves, and resort-style amenities
- Golf
- 36 holes (two Azinger & Lewis par-72 courses) with full practice facilities
- Community size
- Approx. 814 acres with 45 lakes and ponds and 179 acres of preserves
- Memberships
- Up to 1,600 bundled golf memberships
Properties for Sale
Market Snapshot
The number of homes for sale in Heritage Palms Golf & Country Club, South Fort Myers, was 15 in September 2026, down 25% from 20 a year earlier, according to NABOR MLS data through September 2026. This total includes 2 single-family homes and 13 condos available in September 2026. The total inventory has shown a fluctuating trend throughout the year, with a high of 29 units in January 2026. Pricing metrics for Heritage Palms Golf & Country Club indicate a median closed price of $309,000 for all property types in September 2026. This figure is down from $319,000 in September 2025. For condos, the median closed price was $309,000 in September 2026. The median price per square foot for all property types was $237 in September 2026. Sales activity in Heritage Palms Golf & Country Club saw a total of 6 closed sales in September 2026, all of which were condos. This is up from 5 total sales in September 2025, which included 1 single-family home and 4 condos. Pending sales for all property types were 2 in September 2026, down from 2 in September 2025, with no single-family homes and 2 condos pending. Months supply of inventory for all property types in Heritage Palms Golf & Country Club was 2.3 months in September 2026, decreasing from 3.7 months in September 2025. This suggests a tighter market compared to the previous year. For single-family homes, the months supply was 1.1 months in September 2026, based on a small sample of transactions.
October 2026 · Last updated Oct 2, 2026
Pricing
Track how home values are trending in Heritage Palms Golf & Country Club. Median sale prices and price-per-square-foot data help buyers and sellers gauge current market positioning.
Median Closed Price
$309,000 as of September 2026, down 3.1% year-over-year.
View monthly data
| Month | Median Closed Price |
|---|---|
| October 2025 | $315,000 |
| November 2025 | $1,112,500 |
| December 2025 | $695,000 |
| January 2026 | $368,500 |
| February 2026 | $265,000 |
| March 2026 | $279,500 |
| April 2026 | $420,000 |
| May 2026 | $278,893 |
| June 2026 | $425,000 |
| July 2026 | $300,000 |
| August 2026 | $323,000 |
| September 2026 | $309,000 |
Source: Naples Area Board of REALTORS® (NABOR®) MLS, via InfoSparks. Data through September 2026. Data deemed reliable but not guaranteed.
Median Prices per Sq ft
$237 as of September 2026, down 1.7% year-over-year.
View monthly data
| Month | Median Prices per Sq ft |
|---|---|
| October 2025 | $252 |
| November 2025 | $313 |
| December 2025 | $318 |
| January 2026 | $263 |
| February 2026 | $215 |
| March 2026 | $227 |
| April 2026 | $269 |
| May 2026 | $230 |
| June 2026 | $256 |
| July 2026 | $250 |
| August 2026 | $253 |
| September 2026 | $237 |
Source: Naples Area Board of REALTORS® (NABOR®) MLS, via InfoSparks. Data through September 2026. Data deemed reliable but not guaranteed.
Median Closed Price
$309,000 as of September 2026, down 3.1% year-over-year.
View monthly data
| Month | Median Closed Price |
|---|---|
| October 2025 | $315,000 |
| November 2025 | $1,112,500 |
| December 2025 | $695,000 |
| January 2026 | $368,500 |
| February 2026 | $265,000 |
| March 2026 | $279,500 |
| April 2026 | $420,000 |
| May 2026 | $278,893 |
| June 2026 | $425,000 |
| July 2026 | $300,000 |
| August 2026 | $323,000 |
| September 2026 | $309,000 |
Source: Naples Area Board of REALTORS® (NABOR®) MLS, via InfoSparks. Data through September 2026. Data deemed reliable but not guaranteed.
$237 as of September 2026, down 1.7% year-over-year.
View monthly data
| Month | Median Prices per Sq ft |
|---|---|
| October 2025 | $252 |
| November 2025 | $313 |
| December 2025 | $318 |
| January 2026 | $263 |
| February 2026 | $215 |
| March 2026 | $227 |
| April 2026 | $269 |
| May 2026 | $230 |
| June 2026 | $256 |
| July 2026 | $250 |
| August 2026 | $253 |
| September 2026 | $237 |
Source: Naples Area Board of REALTORS® (NABOR®) MLS, via InfoSparks. Data through September 2026. Data deemed reliable but not guaranteed.
Inventory
See how many homes are available in Heritage Palms Golf & Country Club and how quickly inventory is moving. Months of supply indicates whether conditions favor buyers or sellers.
Homes For Sale
15 as of September 2026, down 25.0% year-over-year.
View monthly data
| Month | Homes For Sale |
|---|---|
| October 2025 | 22 |
| November 2025 | 28 |
| December 2025 | 27 |
| January 2026 | 29 |
| February 2026 | 29 |
| March 2026 | 28 |
| April 2026 | 25 |
| May 2026 | 25 |
| June 2026 | 20 |
| July 2026 | 17 |
| August 2026 | 14 |
| September 2026 | 15 |
Source: Naples Area Board of REALTORS® (NABOR®) MLS, via InfoSparks. Data through September 2026. Data deemed reliable but not guaranteed.
Months Supply
2.3 as of September 2026, down 37.8% year-over-year.
View monthly data
| Month | Months Supply |
|---|---|
| October 2025 | 3.9 |
| November 2025 | 4.9 |
| December 2025 | 4.6 |
| January 2026 | 4.5 |
| February 2026 | 4.2 |
| March 2026 | 4 |
| April 2026 | 3.6 |
| May 2026 | 3.7 |
| June 2026 | 2.9 |
| July 2026 | 2.4 |
| August 2026 | 2.2 |
| September 2026 | 2.3 |
Source: Naples Area Board of REALTORS® (NABOR®) MLS, via InfoSparks. Data through September 2026. Data deemed reliable but not guaranteed.
Homes For Sale
15 as of September 2026, down 25.0% year-over-year.
View monthly data
| Month | Homes For Sale |
|---|---|
| October 2025 | 22 |
| November 2025 | 28 |
| December 2025 | 27 |
| January 2026 | 29 |
| February 2026 | 29 |
| March 2026 | 28 |
| April 2026 | 25 |
| May 2026 | 25 |
| June 2026 | 20 |
| July 2026 | 17 |
| August 2026 | 14 |
| September 2026 | 15 |
Source: Naples Area Board of REALTORS® (NABOR®) MLS, via InfoSparks. Data through September 2026. Data deemed reliable but not guaranteed.
2.3 as of September 2026, down 37.8% year-over-year.
View monthly data
| Month | Months Supply |
|---|---|
| October 2025 | 3.9 |
| November 2025 | 4.9 |
| December 2025 | 4.6 |
| January 2026 | 4.5 |
| February 2026 | 4.2 |
| March 2026 | 4 |
| April 2026 | 3.6 |
| May 2026 | 3.7 |
| June 2026 | 2.9 |
| July 2026 | 2.4 |
| August 2026 | 2.2 |
| September 2026 | 2.3 |
Source: Naples Area Board of REALTORS® (NABOR®) MLS, via InfoSparks. Data through September 2026. Data deemed reliable but not guaranteed.
Activity
Monitor real estate transaction volume in Heritage Palms Golf & Country Club. Pending and closed sales reflect the pace of buyer demand and overall market momentum.
Pending Sales
2 as of September 2026, up 0.0% year-over-year.
View monthly data
| Month | Pending Sales |
|---|---|
| October 2025 | 10 |
| November 2025 | 6 |
| December 2025 | 7 |
| January 2026 | 12 |
| February 2026 | 9 |
| March 2026 | 8 |
| April 2026 | 8 |
| May 2026 | 4 |
| June 2026 | 6 |
| July 2026 | 3 |
| August 2026 | 5 |
| September 2026 | 2 |
Source: Naples Area Board of REALTORS® (NABOR®) MLS, via InfoSparks. Data through September 2026. Data deemed reliable but not guaranteed.
Total Sales
6 as of September 2026, up 20.0% year-over-year.
View monthly data
| Month | Total Sales |
|---|---|
| October 2025 | 3 |
| November 2025 | 3 |
| December 2025 | 7 |
| January 2026 | 9 |
| February 2026 | 9 |
| March 2026 | 11 |
| April 2026 | 12 |
| May 2026 | 6 |
| June 2026 | 5 |
| July 2026 | 5 |
| August 2026 | 2 |
| September 2026 | 6 |
Source: Naples Area Board of REALTORS® (NABOR®) MLS, via InfoSparks. Data through September 2026. Data deemed reliable but not guaranteed.
Pending Sales
2 as of September 2026, up 0.0% year-over-year.
View monthly data
| Month | Pending Sales |
|---|---|
| October 2025 | 10 |
| November 2025 | 6 |
| December 2025 | 7 |
| January 2026 | 12 |
| February 2026 | 9 |
| March 2026 | 8 |
| April 2026 | 8 |
| May 2026 | 4 |
| June 2026 | 6 |
| July 2026 | 3 |
| August 2026 | 5 |
| September 2026 | 2 |
Source: Naples Area Board of REALTORS® (NABOR®) MLS, via InfoSparks. Data through September 2026. Data deemed reliable but not guaranteed.
6 as of September 2026, up 20.0% year-over-year.
View monthly data
| Month | Total Sales |
|---|---|
| October 2025 | 3 |
| November 2025 | 3 |
| December 2025 | 7 |
| January 2026 | 9 |
| February 2026 | 9 |
| March 2026 | 11 |
| April 2026 | 12 |
| May 2026 | 6 |
| June 2026 | 5 |
| July 2026 | 5 |
| August 2026 | 2 |
| September 2026 | 6 |
Source: Naples Area Board of REALTORS® (NABOR®) MLS, via InfoSparks. Data through September 2026. Data deemed reliable but not guaranteed.