 Bundled Golf
Fort Myers • South Fort Myers
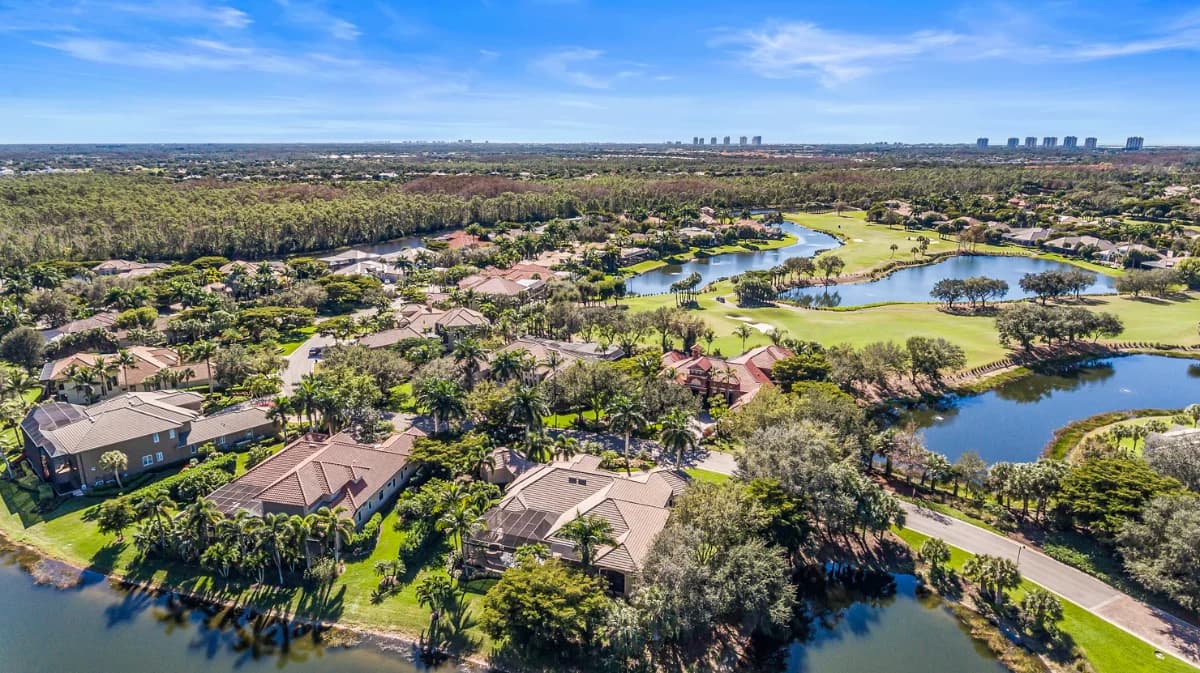
Legends Golf & Country Club
Bundled golf community in Fort Myers with a renovated championship course, resort-style pool, racquet sports, fitness, and multiple dining venues.
Gated~$335k – $750k+
Fort Myers is a historic and evolving city along the Caloosahatchee River, offering a diverse mix of residential options, cultural attractions, and waterfront access. Its range of neighborhoods supports a wide variety of lifestyles.
The downtown River District reflects Fort Myers’ historic roots, while surrounding areas continue to see new development and revitalization. The city’s structure allows for both established living and emerging opportunities.
Residents have access to shopping, dining, healthcare, and nearby Gulf beaches. The lifestyle in Fort Myers can vary widely depending on location, but generally supports a balance of affordability, accessibility, and regional convenience.
The Fort Myers real estate market shows a median sales price of $325,000 across all property types as of April 2026. For single-family homes, the median price was $435,000, while condos had a median price of $246,750 during the same period. Looking back to April 2025, the median sales price for all property types was $365,000, indicating a decrease year-over-year. Inventory levels in Fort Myers remain substantial. In April 2026, there were 3,221 homes for sale across all property types, including 1,476 single-family homes and 1,745 condos. In comparison, April 2025 had a higher total of 4,278 properties available. The months' supply of homes for sale was 7.2 for all property types in April 2026. Recent sales activity in Fort Myers indicates 595 total sales in April 2026, with 311 single-family homes and 284 condos sold. There were 597 pending sales in total. The median price per square foot for all property types was $206 in April 2026, down from $218 in April 2025.
May 2026 · Last updated May 1, 2026
Track how home values are trending in Fort Myers. Median sale prices and price-per-square-foot data help buyers and sellers gauge current market positioning.
Median Closed Price
$325,000 as of June 2026, down 8.5% year-over-year.
| Month | Median Closed Price |
|---|---|
| July 2025 | $335,000 |
| August 2025 | $345,000 |
| September 2025 | $344,500 |
| October 2025 | $360,000 |
| November 2025 | $335,000 |
| December 2025 | $339,000 |
| January 2026 | $347,250 |
| February 2026 | $330,000 |
| March 2026 | $329,999 |
| April 2026 | $324,303 |
| May 2026 | $335,000 |
| June 2026 | $325,000 |
Source: Naples Area Board of REALTORS® (NABOR®) MLS, via InfoSparks. Data through June 2026. Data deemed reliable but not guaranteed.
Median Prices per Sq ft
$193 as of June 2026, down 7.2% year-over-year.
| Month | Median Prices per Sq ft |
|---|---|
| July 2025 | $204 |
| August 2025 | $207 |
| September 2025 | $204 |
| October 2025 | $211 |
| November 2025 | $205 |
| December 2025 | $207 |
| January 2026 | $210 |
| February 2026 | $202 |
| March 2026 | $203 |
| April 2026 | $206 |
| May 2026 | $202 |
| June 2026 | $193 |
Source: Naples Area Board of REALTORS® (NABOR®) MLS, via InfoSparks. Data through June 2026. Data deemed reliable but not guaranteed.
Median Closed Price
$325,000 as of June 2026, down 8.5% year-over-year.
| Month | Median Closed Price |
|---|---|
| July 2025 | $335,000 |
| August 2025 | $345,000 |
| September 2025 | $344,500 |
| October 2025 | $360,000 |
| November 2025 | $335,000 |
| December 2025 | $339,000 |
| January 2026 | $347,250 |
| February 2026 | $330,000 |
| March 2026 | $329,999 |
| April 2026 | $324,303 |
| May 2026 | $335,000 |
| June 2026 | $325,000 |
Source: Naples Area Board of REALTORS® (NABOR®) MLS, via InfoSparks. Data through June 2026. Data deemed reliable but not guaranteed.
$193 as of June 2026, down 7.2% year-over-year.
| Month | Median Prices per Sq ft |
|---|---|
| July 2025 | $204 |
| August 2025 | $207 |
| September 2025 | $204 |
| October 2025 | $211 |
| November 2025 | $205 |
| December 2025 | $207 |
| January 2026 | $210 |
| February 2026 | $202 |
| March 2026 | $203 |
| April 2026 | $206 |
| May 2026 | $202 |
| June 2026 | $193 |
Source: Naples Area Board of REALTORS® (NABOR®) MLS, via InfoSparks. Data through June 2026. Data deemed reliable but not guaranteed.
See how many homes are available in Fort Myers and how quickly inventory is moving. Months of supply indicates whether conditions favor buyers or sellers.
Homes For Sale
2,975 as of May 2026, down 25.3% year-over-year.
| Month | Homes For Sale |
|---|---|
| June 2025 | 3,630 |
| July 2025 | 3,284 |
| August 2025 | 3,056 |
| September 2025 | 3,014 |
| October 2025 | 3,259 |
| November 2025 | 3,421 |
| December 2025 | 3,335 |
| January 2026 | 3,550 |
| February 2026 | 3,628 |
| March 2026 | 3,437 |
| April 2026 | 3,211 |
| May 2026 | 2,975 |
Source: Naples Area Board of REALTORS® (NABOR®) MLS, via InfoSparks. Data through May 2026. Data deemed reliable but not guaranteed.
Months Supply
6 as of June 2026, down 31.8% year-over-year.
| Month | Months Supply |
|---|---|
| July 2025 | 7.9 |
| August 2025 | 7.4 |
| September 2025 | 7.3 |
| October 2025 | 7.8 |
| November 2025 | 8.1 |
| December 2025 | 7.8 |
| January 2026 | 8.2 |
| February 2026 | 8.3 |
| March 2026 | 7.8 |
| April 2026 | 7.2 |
| May 2026 | 6.7 |
| June 2026 | 6 |
Source: Naples Area Board of REALTORS® (NABOR®) MLS, via InfoSparks. Data through June 2026. Data deemed reliable but not guaranteed.
Homes For Sale
2,975 as of May 2026, down 25.3% year-over-year.
| Month | Homes For Sale |
|---|---|
| June 2025 | 3,630 |
| July 2025 | 3,284 |
| August 2025 | 3,056 |
| September 2025 | 3,014 |
| October 2025 | 3,259 |
| November 2025 | 3,421 |
| December 2025 | 3,335 |
| January 2026 | 3,550 |
| February 2026 | 3,628 |
| March 2026 | 3,437 |
| April 2026 | 3,211 |
| May 2026 | 2,975 |
Source: Naples Area Board of REALTORS® (NABOR®) MLS, via InfoSparks. Data through May 2026. Data deemed reliable but not guaranteed.
6 as of June 2026, down 31.8% year-over-year.
| Month | Months Supply |
|---|---|
| July 2025 | 7.9 |
| August 2025 | 7.4 |
| September 2025 | 7.3 |
| October 2025 | 7.8 |
| November 2025 | 8.1 |
| December 2025 | 7.8 |
| January 2026 | 8.2 |
| February 2026 | 8.3 |
| March 2026 | 7.8 |
| April 2026 | 7.2 |
| May 2026 | 6.7 |
| June 2026 | 6 |
Source: Naples Area Board of REALTORS® (NABOR®) MLS, via InfoSparks. Data through June 2026. Data deemed reliable but not guaranteed.
Monitor real estate transaction volume in Fort Myers. Pending and closed sales reflect the pace of buyer demand and overall market momentum.
Pending Sales
454 as of June 2026, up 4.1% year-over-year.
| Month | Pending Sales |
|---|---|
| July 2025 | 390 |
| August 2025 | 355 |
| September 2025 | 365 |
| October 2025 | 426 |
| November 2025 | 392 |
| December 2025 | 340 |
| January 2026 | 555 |
| February 2026 | 558 |
| March 2026 | 659 |
| April 2026 | 575 |
| May 2026 | 472 |
| June 2026 | 454 |
Source: Naples Area Board of REALTORS® (NABOR®) MLS, via InfoSparks. Data through June 2026. Data deemed reliable but not guaranteed.
Total Sales
526 as of June 2026, up 8.9% year-over-year.
| Month | Total Sales |
|---|---|
| July 2025 | 419 |
| August 2025 | 402 |
| September 2025 | 348 |
| October 2025 | 386 |
| November 2025 | 357 |
| December 2025 | 451 |
| January 2026 | 329 |
| February 2026 | 462 |
| March 2026 | 610 |
| April 2026 | 637 |
| May 2026 | 537 |
| June 2026 | 526 |
Source: Naples Area Board of REALTORS® (NABOR®) MLS, via InfoSparks. Data through June 2026. Data deemed reliable but not guaranteed.
Pending Sales
454 as of June 2026, up 4.1% year-over-year.
| Month | Pending Sales |
|---|---|
| July 2025 | 390 |
| August 2025 | 355 |
| September 2025 | 365 |
| October 2025 | 426 |
| November 2025 | 392 |
| December 2025 | 340 |
| January 2026 | 555 |
| February 2026 | 558 |
| March 2026 | 659 |
| April 2026 | 575 |
| May 2026 | 472 |
| June 2026 | 454 |
Source: Naples Area Board of REALTORS® (NABOR®) MLS, via InfoSparks. Data through June 2026. Data deemed reliable but not guaranteed.
526 as of June 2026, up 8.9% year-over-year.
| Month | Total Sales |
|---|---|
| July 2025 | 419 |
| August 2025 | 402 |
| September 2025 | 348 |
| October 2025 | 386 |
| November 2025 | 357 |
| December 2025 | 451 |
| January 2026 | 329 |
| February 2026 | 462 |
| March 2026 | 610 |
| April 2026 | 637 |
| May 2026 | 537 |
| June 2026 | 526 |
Source: Naples Area Board of REALTORS® (NABOR®) MLS, via InfoSparks. Data through June 2026. Data deemed reliable but not guaranteed.
Bundled GolfBundled golf community in Fort Myers with a renovated championship course, resort-style pool, racquet sports, fitness, and multiple dining venues.
 Bundled Golf
Audubon-certified bundled golf community in Fort Myers between Sanibel Island and Fort Myers Beach, with an 18-hole course, full practice facilities, fitness, tennis, and resort-style pool.
 community
Riverfront bundled golf, yacht, and tennis community in Fort Myers with an executive course, marina, racquet sports, fitness, and resort-style pool.