Lake Park
Up to $400/mo
Lake Park runs out, at its north edge, into a ballpark. Fleischmann Park fills the ground between the last houses and Fleischmann Boulevard: baseball and softball fields with batting cages, a football field, pickleball and basketball courts, two sand volleyball courts, two playgrounds, a covered shelter called Panther Pavilion and the Fleischmann Park Community Center. Where US 41 meets Fleischmann Boulevard, at the north-west corner, the Naples Preserve keeps a block of native scrub and pine. Cross Goodlette-Frank Road on the east side and you reach Naples Zoo at Caribbean Gardens and the Conservancy of Southwest Florida's Nature Center.
Between those edges lies an older grid of detached houses in central Naples. It isn't a planned community: there's no developer behind it, no club and no gatehouse. Its streets run from 5th Avenue North to 15th Avenue North, between Tamiami Trail North on the west (US 41, signed 9th Street North along that side) and Goodlette-Frank Road on the east, with small lakes set inside some of the blocks. You don't join anything to live here, and none of the parks nearby is part of what you buy.
What is there to do inside Lake Park?
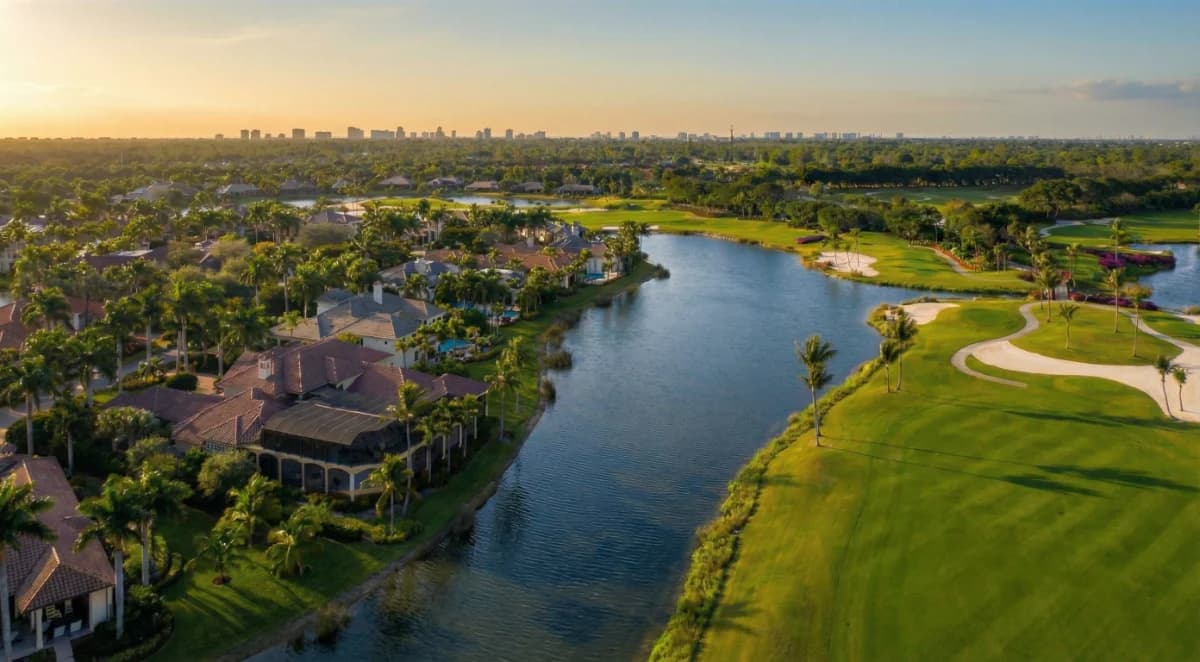
Start with the water. Willow Lake, Forrest Lake and Lake Manor are tucked into the blocks, with a fourth lake off 15th Avenue North, and some of the houses look out over one of them. The side streets in between are 10th to 13th Street North, Broad Avenue North, 6th Lane North, 8th Terrace North, 11th Court North and Forest Avenue.
Fleischmann Park is 0.5 to 1.1 miles from the houses along the streets, depending on which one you start from. Besides the ball fields and courts, it has two playgrounds, Panther Pavilion for shelter and a community center indoors.
Inside the Naples Preserve, a boardwalk loop runs through the scrub and pine, past a small pond, to the Hedges Family Eco Center, and it's 0.4 to 1.2 miles from the houses. Just south of 5th Avenue North, River Park has a community center of its own at 301 11th Street North, and a swimming pool.
How far is it to the zoo, the shops and Fifth Avenue South?
Each distance below is a range, measured from the houses along streets and paths, because it changes with the block you leave from.
The zoo and the Nature Center, across Goodlette-Frank Road on Smith Preserve Way, are each 0.6 to 1.2 miles away. Past the zoo, the Gordon River Greenway follows the river as a path for walking and cycling; riding there covers roughly 1.25 to 1.8 miles.
Errands go west. Coastland Center, the mall at 1900 Tamiami Trail North, has shops, restaurants and a cinema, 0.6 to 1.3 miles off. A Publix on Tamiami Trail North is 0.7 to 1.5 miles.
Fifth Avenue South takes longer. Its corner with 8th Street South is 1.1 to 1.8 miles away, and its west end at Third Street South is 1.6 to 2.2 miles by bike. Lowdermilk Park, on Gulf Shore Boulevard North, is 1.2 to 1.7 miles by bike. Naples Pier is farther still, 2.4 to 3 miles.
How long are the drives from Lake Park?
Short, out of season. From the middle of the neighborhood with no traffic, the zoo and the Nature Center are 3 to 4 minutes away, and Coastland Center about 1 mile. Fifth Avenue South is about 1.6 miles, around 5 minutes. Lowdermilk Park is about 1.3 miles, and Naples Pier about 2.9 miles, around 8 minutes.
Farther afield, on the same basis:
- NCH Baker Hospital, about 1 mile (3 minutes)
- Waterside Shops, about 4.3 miles (9 minutes)
- Naples Botanical Garden, about 4.8 miles (11 minutes)
- Mercato, about 6.9 miles (13 minutes)
- Southwest Florida International Airport terminal, about 32 miles (43 minutes)
In season, expect all of them to take longer.
What are the houses like, and what have they sold for?
Two generations stand side by side, and they sell as two separate markets. The originals went up between the 1950s and the 1970s, mostly as single-story ranch houses. Since 2013, many lots have been rebuilt with larger new houses, often two stories, and many of the houses that come up for sale are new ones.
The size gap between them is wide: original houses that have come up for sale run from about 750 to about 2,600 square feet; the new ones from about 1,950 to about 4,700. Across both, expect 2 to 5 bedrooms, lots of about 0.15 to 0.30 acres, and in most cases a private pool.
Between April 2025 and October 2026, the original houses sold from about $900,000 to around $2.5 million. The new houses sold from about $2 million to around $5 million. Price a house against its own generation, not the neighborhood as a whole.
Is there an HOA fee in Lake Park?
No. The houses carry no homeowners' association fee, because there is no association.
That cuts both ways. With no association there is no rulebook, and nobody to set or enforce leasing limits, architectural rules or upkeep standards. Whatever rules do apply come from local government and from anything recorded against the land when the lots were first laid out. Neither is something to guess at, so check both for the exact address, and especially before planning a renovation or a rebuild.
What should you know before buying in Lake Park?
The edges are commercial. Restaurants, shops, offices and car showrooms line US 41 on the west side, and medical offices sit along Goodlette-Frank Road on the east. On the outer streets, look at what stands behind the back fence before you look at the kitchen.
The rebuilding is lot by lot, too. An original ranch house can sit next to a new two-story one, and with no association there are no architectural rules to keep the street in step. The house beside yours can change shape the same way.
One small condominium complex sits on 7th Avenue North near the south-east corner. Every other building inside the grid is a house.
Quick Facts
- Home Prices
- Originals $900,000–$2.5M; new houses $2M–$5M
- Monthly Fees
- Up to $400/mo
- Initiation Fee
- No initiation fee
- Gated
- No
- Residences
- Detached houses, plus one small condominium complex
- Location
- Central Naples, between US 41 and Goodlette-Frank Road
- Streets
- Open grid, 5th to 15th Avenue North; no gate, no club
- First Homes Built
- Originals 1950s–1970s; rebuilding since 2013
- House Sizes
- Originals about 750–2,600 sq ft; new 1,950–4,700
- Bedrooms
- 2–5
- Lots
- About 0.15–0.30 acres, most with a private pool
Properties for Sale
Market Snapshot
The median closed price in Lake Park, Central Naples, was $3,550,000 for single-family homes in September 2026, up from $1,850,000 in September 2025, according to NABOR MLS data through September 2026. For all property types, the median closed price in Lake Park in September 2026 was $3,550,000, significantly higher than the $1,100,000 reported in September 2025. There was one condo sale in September 2025 at $330,000, but no condo sales were recorded in September 2026. Inventory levels for all property types in Lake Park were 14 homes for sale in September 2026, down from 18 homes for sale in September 2025. Single-family homes for sale decreased to 14 in September 2026 from 18 in September 2025. There were no condos for sale in September 2026, while there were none in September 2025. Months supply of inventory for all property types was 7.8 months in September 2026, compared to 9.5 months in September 2025. Sales activity saw a total of 1 closed sale across all property types in Lake Park in September 2026, compared to 3 closed sales in September 2025. Specifically, there was 1 single-family home sale in September 2026, down from 2 in September 2025. Pending sales were 0 in September 2026, a decrease from 1 pending sale in September 2025. These figures for sales and pending sales are based on a small number of transactions in the past year. The median price per square foot for single-family homes in Lake Park was $943 in September 2026, compared to $903 in September 2025. For all property types, the median price per square foot was $943 in September 2026, up from $810 in September 2025.
October 2026 · Last updated Oct 2, 2026
Pricing
Track how home values are trending in Lake Park. Median sale prices and price-per-square-foot data help buyers and sellers gauge current market positioning.
Median Closed Price
$3,550,000 as of September 2026, up 222.7% year-over-year.
View monthly data
| Month | Median Closed Price |
|---|---|
| August 2025 | $2,087,500 |
| September 2025 | $1,100,000 |
| October 2025 | $4,500,000 |
| November 2025 | $1,435,000 |
| December 2025 | $1,625,000 |
| January 2026 | $1,000,000 |
| February 2026 | $3,500,000 |
| March 2026 | $2,600,000 |
| May 2026 | $1,195,000 |
| June 2026 | $1,300,000 |
| August 2026 | $3,937,500 |
| September 2026 | $3,550,000 |
Source: Naples Area Board of REALTORS® (NABOR®) MLS, via InfoSparks. Data through September 2026. Data deemed reliable but not guaranteed.
Median Prices per Sq ft
$943 as of September 2026, up 16.4% year-over-year.
View monthly data
| Month | Median Prices per Sq ft |
|---|---|
| August 2025 | $650 |
| September 2025 | $810 |
| October 2025 | $996 |
| November 2025 | $719 |
| December 2025 | $933 |
| January 2026 | $916 |
| February 2026 | $1,012 |
| March 2026 | $948 |
| May 2026 | $985 |
| June 2026 | $829 |
| August 2026 | $1,013 |
| September 2026 | $943 |
Source: Naples Area Board of REALTORS® (NABOR®) MLS, via InfoSparks. Data through September 2026. Data deemed reliable but not guaranteed.
Median Closed Price
$3,550,000 as of September 2026, up 222.7% year-over-year.
View monthly data
| Month | Median Closed Price |
|---|---|
| August 2025 | $2,087,500 |
| September 2025 | $1,100,000 |
| October 2025 | $4,500,000 |
| November 2025 | $1,435,000 |
| December 2025 | $1,625,000 |
| January 2026 | $1,000,000 |
| February 2026 | $3,500,000 |
| March 2026 | $2,600,000 |
| May 2026 | $1,195,000 |
| June 2026 | $1,300,000 |
| August 2026 | $3,937,500 |
| September 2026 | $3,550,000 |
Source: Naples Area Board of REALTORS® (NABOR®) MLS, via InfoSparks. Data through September 2026. Data deemed reliable but not guaranteed.
$943 as of September 2026, up 16.4% year-over-year.
View monthly data
| Month | Median Prices per Sq ft |
|---|---|
| August 2025 | $650 |
| September 2025 | $810 |
| October 2025 | $996 |
| November 2025 | $719 |
| December 2025 | $933 |
| January 2026 | $916 |
| February 2026 | $1,012 |
| March 2026 | $948 |
| May 2026 | $985 |
| June 2026 | $829 |
| August 2026 | $1,013 |
| September 2026 | $943 |
Source: Naples Area Board of REALTORS® (NABOR®) MLS, via InfoSparks. Data through September 2026. Data deemed reliable but not guaranteed.
Inventory
See how many homes are available in Lake Park and how quickly inventory is moving. Months of supply indicates whether conditions favor buyers or sellers.
Homes For Sale
17 as of September 2026, down 5.6% year-over-year.
View monthly data
| Month | Homes For Sale |
|---|---|
| October 2025 | 22 |
| November 2025 | 22 |
| December 2025 | 23 |
| January 2026 | 23 |
| February 2026 | 24 |
| March 2026 | 24 |
| April 2026 | 22 |
| May 2026 | 17 |
| June 2026 | 18 |
| July 2026 | 18 |
| August 2026 | 11 |
| September 2026 | 17 |
Source: Naples Area Board of REALTORS® (NABOR®) MLS, via InfoSparks. Data through September 2026. Data deemed reliable but not guaranteed.
Months Supply
9.4 as of September 2026, down 1.1% year-over-year.
View monthly data
| Month | Months Supply |
|---|---|
| October 2025 | 12.2 |
| November 2025 | 12.2 |
| December 2025 | 12.1 |
| January 2026 | 11.5 |
| February 2026 | 11.4 |
| March 2026 | 11.4 |
| April 2026 | 9.9 |
| May 2026 | 7.4 |
| June 2026 | 9 |
| July 2026 | 9 |
| August 2026 | 5.5 |
| September 2026 | 9.4 |
Source: Naples Area Board of REALTORS® (NABOR®) MLS, via InfoSparks. Data through September 2026. Data deemed reliable but not guaranteed.
Homes For Sale
17 as of September 2026, down 5.6% year-over-year.
View monthly data
| Month | Homes For Sale |
|---|---|
| October 2025 | 22 |
| November 2025 | 22 |
| December 2025 | 23 |
| January 2026 | 23 |
| February 2026 | 24 |
| March 2026 | 24 |
| April 2026 | 22 |
| May 2026 | 17 |
| June 2026 | 18 |
| July 2026 | 18 |
| August 2026 | 11 |
| September 2026 | 17 |
Source: Naples Area Board of REALTORS® (NABOR®) MLS, via InfoSparks. Data through September 2026. Data deemed reliable but not guaranteed.
9.4 as of September 2026, down 1.1% year-over-year.
View monthly data
| Month | Months Supply |
|---|---|
| October 2025 | 12.2 |
| November 2025 | 12.2 |
| December 2025 | 12.1 |
| January 2026 | 11.5 |
| February 2026 | 11.4 |
| March 2026 | 11.4 |
| April 2026 | 9.9 |
| May 2026 | 7.4 |
| June 2026 | 9 |
| July 2026 | 9 |
| August 2026 | 5.5 |
| September 2026 | 9.4 |
Source: Naples Area Board of REALTORS® (NABOR®) MLS, via InfoSparks. Data through September 2026. Data deemed reliable but not guaranteed.
Activity
Monitor real estate transaction volume in Lake Park. Pending and closed sales reflect the pace of buyer demand and overall market momentum.
Pending Sales
0 as of September 2026, down 100.0% year-over-year.
View monthly data
| Month | Pending Sales |
|---|---|
| October 2025 | 2 |
| November 2025 | 2 |
| December 2025 | 1 |
| January 2026 | 2 |
| February 2026 | 2 |
| March 2026 | 1 |
| April 2026 | 2 |
| May 2026 | 1 |
| June 2026 | 1 |
| July 2026 | 0 |
| August 2026 | 4 |
| September 2026 | 0 |
Source: Naples Area Board of REALTORS® (NABOR®) MLS, via InfoSparks. Data through September 2026. Data deemed reliable but not guaranteed.
Total Sales
1 as of September 2026, down 66.7% year-over-year.
View monthly data
| Month | Total Sales |
|---|---|
| October 2025 | 1 |
| November 2025 | 2 |
| December 2025 | 2 |
| January 2026 | 3 |
| February 2026 | 2 |
| March 2026 | 1 |
| April 2026 | 0 |
| May 2026 | 3 |
| June 2026 | 1 |
| July 2026 | 0 |
| August 2026 | 2 |
| September 2026 | 1 |
Source: Naples Area Board of REALTORS® (NABOR®) MLS, via InfoSparks. Data through September 2026. Data deemed reliable but not guaranteed.
Pending Sales
0 as of September 2026, down 100.0% year-over-year.
View monthly data
| Month | Pending Sales |
|---|---|
| October 2025 | 2 |
| November 2025 | 2 |
| December 2025 | 1 |
| January 2026 | 2 |
| February 2026 | 2 |
| March 2026 | 1 |
| April 2026 | 2 |
| May 2026 | 1 |
| June 2026 | 1 |
| July 2026 | 0 |
| August 2026 | 4 |
| September 2026 | 0 |
Source: Naples Area Board of REALTORS® (NABOR®) MLS, via InfoSparks. Data through September 2026. Data deemed reliable but not guaranteed.
1 as of September 2026, down 66.7% year-over-year.
View monthly data
| Month | Total Sales |
|---|---|
| October 2025 | 1 |
| November 2025 | 2 |
| December 2025 | 2 |
| January 2026 | 3 |
| February 2026 | 2 |
| March 2026 | 1 |
| April 2026 | 0 |
| May 2026 | 3 |
| June 2026 | 1 |
| July 2026 | 0 |
| August 2026 | 2 |
| September 2026 | 1 |
Source: Naples Area Board of REALTORS® (NABOR®) MLS, via InfoSparks. Data through September 2026. Data deemed reliable but not guaranteed.