 Bundled Golf
Naples • Central Naples
High Point Country Club
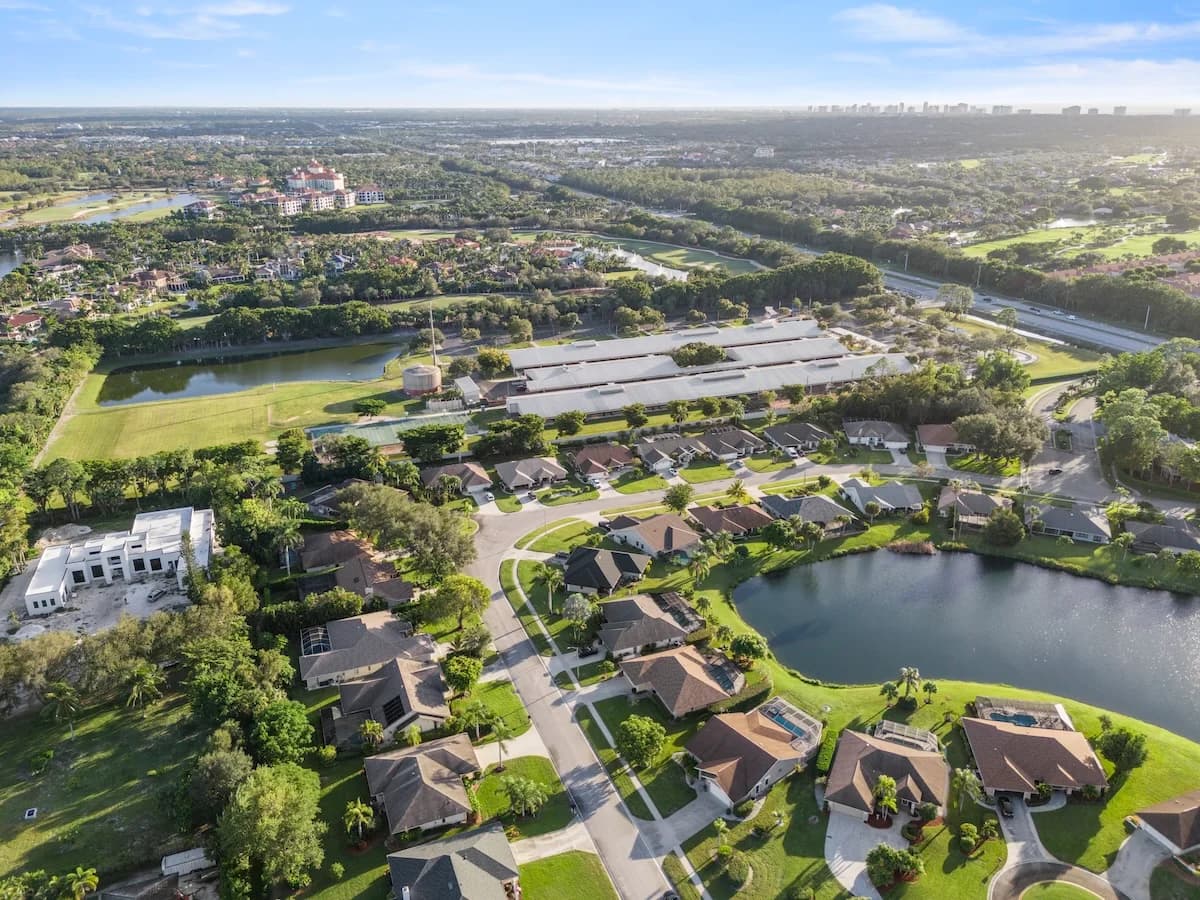
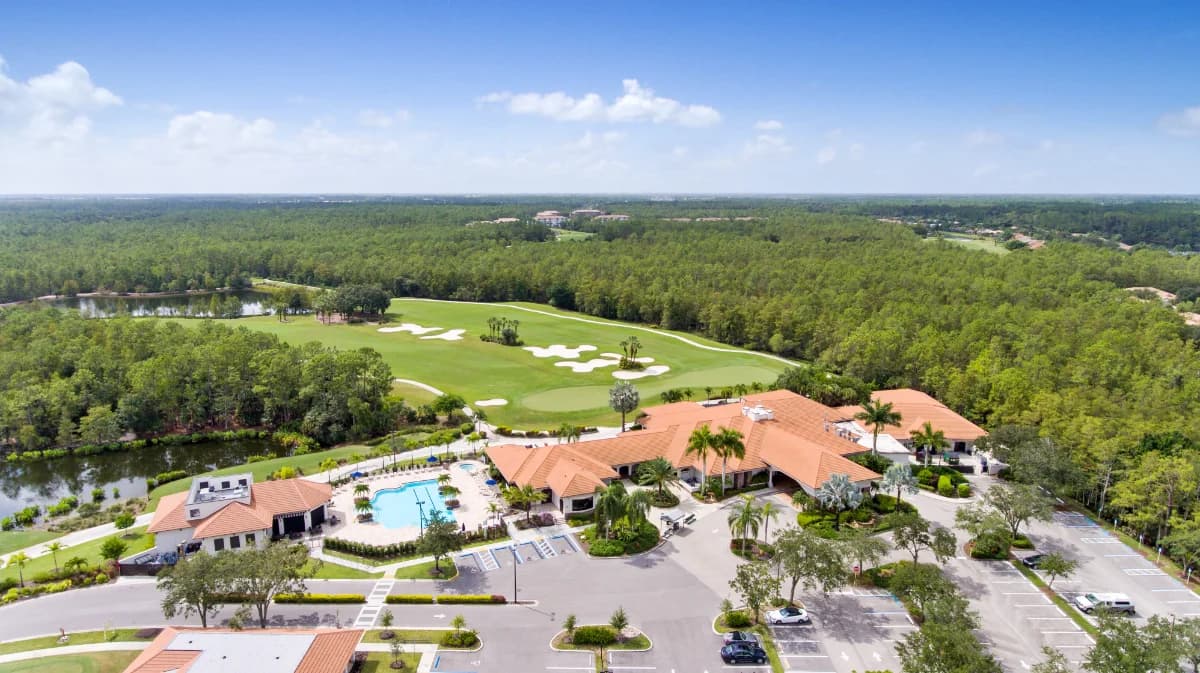
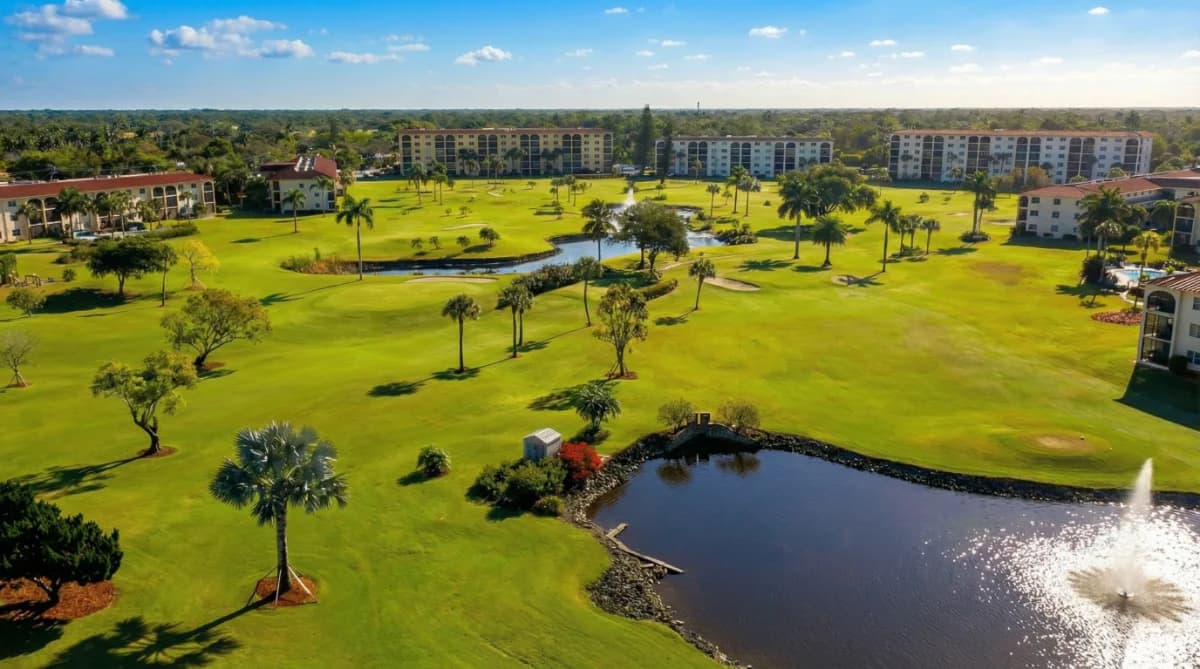
Affordable, walkable bundled golf condo community in central Naples with a par-3 course and six pools minutes from the beach.
Not gated~$200k – $550k+
Central Naples encompasses a collection of established neighborhoods positioned between the Gulf and Interstate 75. Known for its accessibility and everyday convenience, the area offers a mix of single-family homes, condominiums, and gated communities.
Residents benefit from close proximity to major roadways, shopping centers, schools, and healthcare facilities. The area is designed for ease of movement, making it well-suited for year-round living and those seeking a more practical, centrally located base.
While not always directly on the water, Central Naples provides quick access to the beach as well as downtown destinations. Its balance of location, value, and convenience supports a lifestyle that prioritizes functionality without losing connection to the broader Naples experience.
Here's a snapshot of the Central Naples real estate market as of April 2026. The month saw 109 total sales, along with 116 pending sales, showing sustained buyer interest in the area. Inventory remains considerable with 576 homes for sale. The months supply of homes for sale sits at 6.0. Pricing in Central Naples shows some fluctuation. The median sales price in April 2026 was $450,000, down slightly from $455,000 in March 2026. The median price per square foot in April 2026 was $299, up from $293 the previous month. Looking at the broader trend, the months supply of homes for sale in Central Naples has decreased to 6.0 in April 2026, down from a high of 10.1 in March 2025.
May 2026 · Last updated May 1, 2026
Track how home values are trending in Central Naples. Median sale prices and price-per-square-foot data help buyers and sellers gauge current market positioning.
Median Closed Price
$460,000 as of June 2026, down 11.1% year-over-year.
| Month | Median Closed Price |
|---|---|
| July 2025 | $405,000 |
| August 2025 | $400,000 |
| September 2025 | $390,000 |
| October 2025 | $420,000 |
| November 2025 | $420,000 |
| December 2025 | $450,000 |
| January 2026 | $484,000 |
| February 2026 | $475,000 |
| March 2026 | $455,000 |
| April 2026 | $445,000 |
| May 2026 | $442,500 |
| June 2026 | $460,000 |
Source: Naples Area Board of REALTORS® (NABOR®) MLS, via InfoSparks. Data through June 2026. Data deemed reliable but not guaranteed.
Median Prices per Sq ft
$277 as of June 2026, down 8.6% year-over-year.
| Month | Median Prices per Sq ft |
|---|---|
| July 2025 | $271 |
| August 2025 | $257 |
| September 2025 | $262 |
| October 2025 | $287 |
| November 2025 | $285 |
| December 2025 | $271 |
| January 2026 | $291 |
| February 2026 | $277 |
| March 2026 | $293 |
| April 2026 | $295 |
| May 2026 | $283 |
| June 2026 | $277 |
Source: Naples Area Board of REALTORS® (NABOR®) MLS, via InfoSparks. Data through June 2026. Data deemed reliable but not guaranteed.
Median Closed Price
$460,000 as of June 2026, down 11.1% year-over-year.
| Month | Median Closed Price |
|---|---|
| July 2025 | $405,000 |
| August 2025 | $400,000 |
| September 2025 | $390,000 |
| October 2025 | $420,000 |
| November 2025 | $420,000 |
| December 2025 | $450,000 |
| January 2026 | $484,000 |
| February 2026 | $475,000 |
| March 2026 | $455,000 |
| April 2026 | $445,000 |
| May 2026 | $442,500 |
| June 2026 | $460,000 |
Source: Naples Area Board of REALTORS® (NABOR®) MLS, via InfoSparks. Data through June 2026. Data deemed reliable but not guaranteed.
$277 as of June 2026, down 8.6% year-over-year.
| Month | Median Prices per Sq ft |
|---|---|
| July 2025 | $271 |
| August 2025 | $257 |
| September 2025 | $262 |
| October 2025 | $287 |
| November 2025 | $285 |
| December 2025 | $271 |
| January 2026 | $291 |
| February 2026 | $277 |
| March 2026 | $293 |
| April 2026 | $295 |
| May 2026 | $283 |
| June 2026 | $277 |
Source: Naples Area Board of REALTORS® (NABOR®) MLS, via InfoSparks. Data through June 2026. Data deemed reliable but not guaranteed.
See how many homes are available in Central Naples and how quickly inventory is moving. Months of supply indicates whether conditions favor buyers or sellers.
Homes For Sale
470 as of June 2026, down 35.4% year-over-year.
| Month | Homes For Sale |
|---|---|
| July 2025 | 650 |
| August 2025 | 592 |
| September 2025 | 576 |
| October 2025 | 624 |
| November 2025 | 630 |
| December 2025 | 624 |
| January 2026 | 672 |
| February 2026 | 679 |
| March 2026 | 646 |
| April 2026 | 585 |
| May 2026 | 538 |
| June 2026 | 470 |
Source: Naples Area Board of REALTORS® (NABOR®) MLS, via InfoSparks. Data through June 2026. Data deemed reliable but not guaranteed.
Months Supply
4.7 as of June 2026, down 44.0% year-over-year.
| Month | Months Supply |
|---|---|
| July 2025 | 7.5 |
| August 2025 | 6.8 |
| September 2025 | 6.5 |
| October 2025 | 6.9 |
| November 2025 | 6.9 |
| December 2025 | 6.6 |
| January 2026 | 7.1 |
| February 2026 | 7.1 |
| March 2026 | 6.6 |
| April 2026 | 6 |
| May 2026 | 5.5 |
| June 2026 | 4.7 |
Source: Naples Area Board of REALTORS® (NABOR®) MLS, via InfoSparks. Data through June 2026. Data deemed reliable but not guaranteed.
Homes For Sale
470 as of June 2026, down 35.4% year-over-year.
| Month | Homes For Sale |
|---|---|
| July 2025 | 650 |
| August 2025 | 592 |
| September 2025 | 576 |
| October 2025 | 624 |
| November 2025 | 630 |
| December 2025 | 624 |
| January 2026 | 672 |
| February 2026 | 679 |
| March 2026 | 646 |
| April 2026 | 585 |
| May 2026 | 538 |
| June 2026 | 470 |
Source: Naples Area Board of REALTORS® (NABOR®) MLS, via InfoSparks. Data through June 2026. Data deemed reliable but not guaranteed.
4.7 as of June 2026, down 44.0% year-over-year.
| Month | Months Supply |
|---|---|
| July 2025 | 7.5 |
| August 2025 | 6.8 |
| September 2025 | 6.5 |
| October 2025 | 6.9 |
| November 2025 | 6.9 |
| December 2025 | 6.6 |
| January 2026 | 7.1 |
| February 2026 | 7.1 |
| March 2026 | 6.6 |
| April 2026 | 6 |
| May 2026 | 5.5 |
| June 2026 | 4.7 |
Source: Naples Area Board of REALTORS® (NABOR®) MLS, via InfoSparks. Data through June 2026. Data deemed reliable but not guaranteed.
Monitor real estate transaction volume in Central Naples. Pending and closed sales reflect the pace of buyer demand and overall market momentum.
Pending Sales
105 as of May 2026, up 1.9% year-over-year.
| Month | Pending Sales |
|---|---|
| June 2025 | 64 |
| July 2025 | 86 |
| August 2025 | 95 |
| September 2025 | 77 |
| October 2025 | 95 |
| November 2025 | 111 |
| December 2025 | 81 |
| January 2026 | 114 |
| February 2026 | 121 |
| March 2026 | 127 |
| April 2026 | 119 |
| May 2026 | 105 |
Source: Naples Area Board of REALTORS® (NABOR®) MLS, via InfoSparks. Data through May 2026. Data deemed reliable but not guaranteed.
Total Sales
123 as of June 2026, up 20.6% year-over-year.
| Month | Total Sales |
|---|---|
| July 2025 | 83 |
| August 2025 | 79 |
| September 2025 | 93 |
| October 2025 | 89 |
| November 2025 | 75 |
| December 2025 | 116 |
| January 2026 | 78 |
| February 2026 | 92 |
| March 2026 | 130 |
| April 2026 | 116 |
| May 2026 | 118 |
| June 2026 | 123 |
Source: Naples Area Board of REALTORS® (NABOR®) MLS, via InfoSparks. Data through June 2026. Data deemed reliable but not guaranteed.
Pending Sales
105 as of May 2026, up 1.9% year-over-year.
| Month | Pending Sales |
|---|---|
| June 2025 | 64 |
| July 2025 | 86 |
| August 2025 | 95 |
| September 2025 | 77 |
| October 2025 | 95 |
| November 2025 | 111 |
| December 2025 | 81 |
| January 2026 | 114 |
| February 2026 | 121 |
| March 2026 | 127 |
| April 2026 | 119 |
| May 2026 | 105 |
Source: Naples Area Board of REALTORS® (NABOR®) MLS, via InfoSparks. Data through May 2026. Data deemed reliable but not guaranteed.
123 as of June 2026, up 20.6% year-over-year.
| Month | Total Sales |
|---|---|
| July 2025 | 83 |
| August 2025 | 79 |
| September 2025 | 93 |
| October 2025 | 89 |
| November 2025 | 75 |
| December 2025 | 116 |
| January 2026 | 78 |
| February 2026 | 92 |
| March 2026 | 130 |
| April 2026 | 116 |
| May 2026 | 118 |
| June 2026 | 123 |
Source: Naples Area Board of REALTORS® (NABOR®) MLS, via InfoSparks. Data through June 2026. Data deemed reliable but not guaranteed.
Bundled GolfAffordable, walkable bundled golf condo community in central Naples with a par-3 course and six pools minutes from the beach.
Exclusive beachfront community within Pelican Bay offering luxury high-rise and estate living with private beach access.
 Bundled Golf
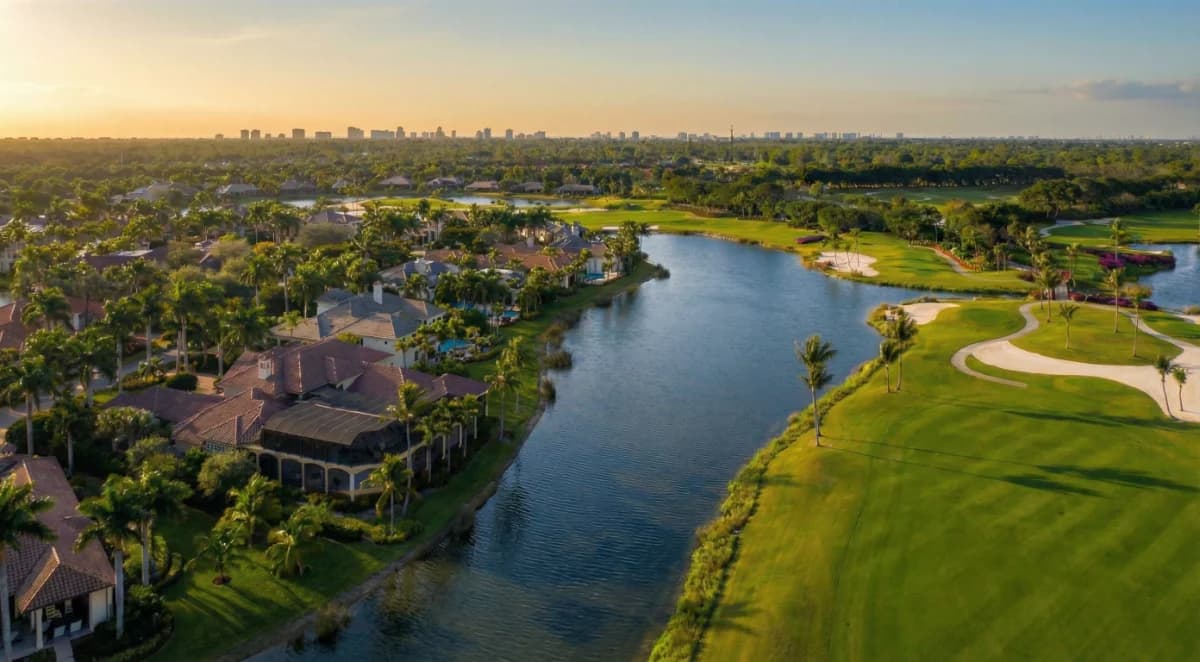
Premier private club community in Naples featuring championship golf, world-class amenities and refined living.