 area
area
Naples
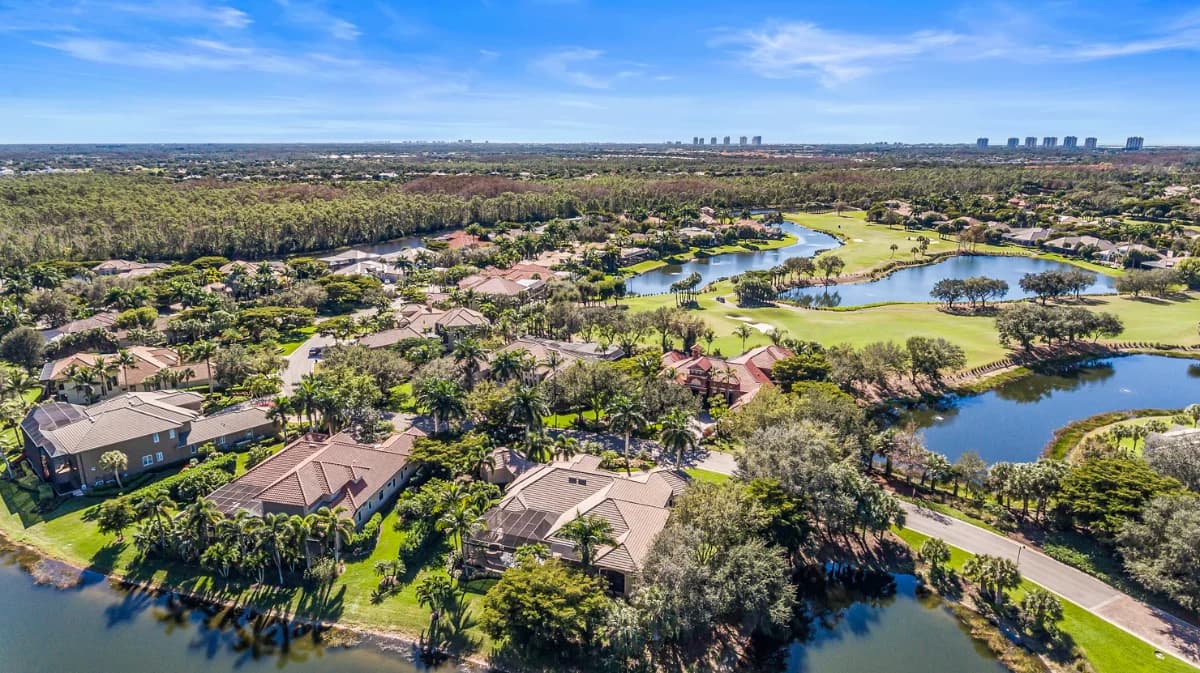
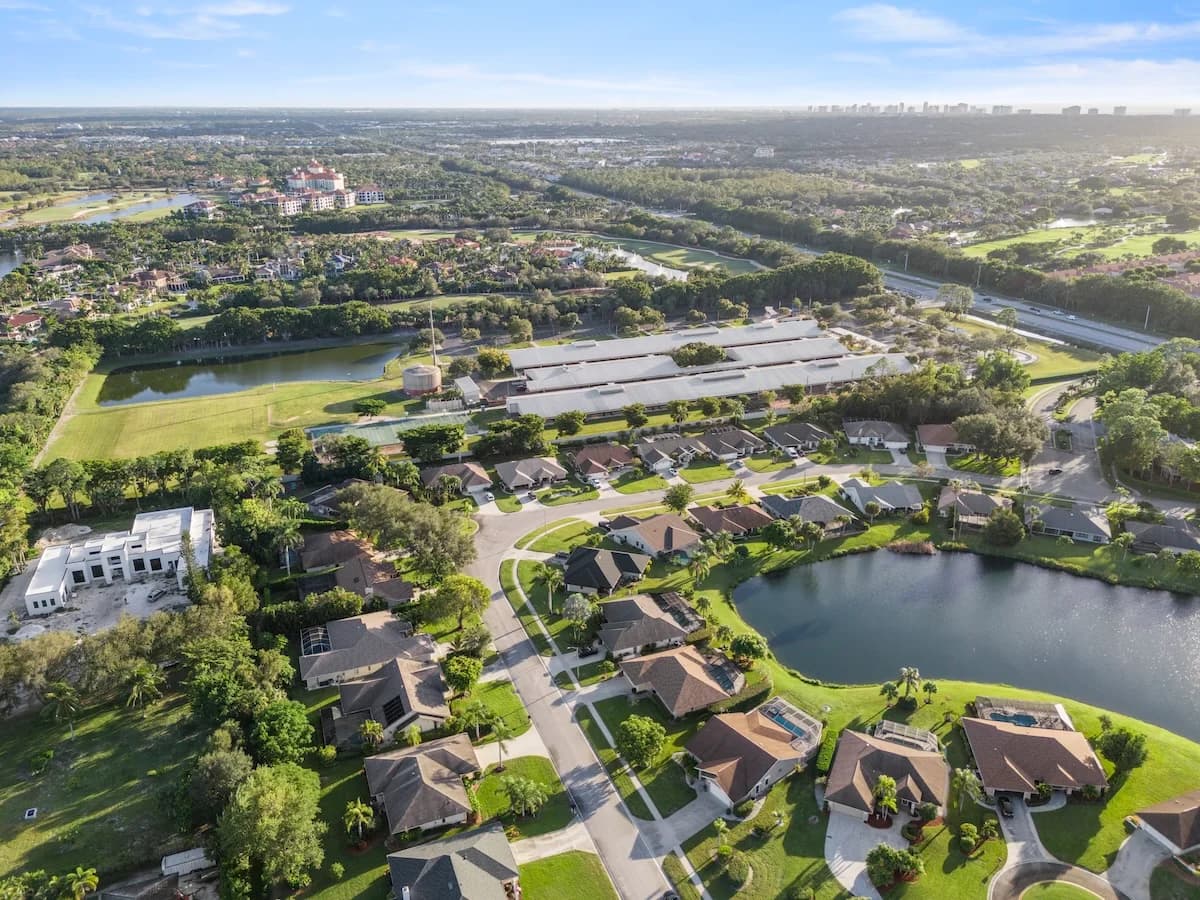
Naples is a coastal city known for its refined atmosphere, Gulf beaches, and well-established residential communities. It offers a blend of waterfront living, golf communities, and walkable neighborhoods throughout the area.
Coastal Setting & Amenities
The city is defined by its access to the Gulf of Mexico, along with a wide range of amenities including golf courses, marinas, parks, and cultural institutions. Its infrastructure supports both seasonal and year-round living.
Location & Lifestyle
From Old Naples to North Naples and beyond, the city provides a variety of living environments connected by a shared coastal identity. The lifestyle emphasizes outdoor living, accessibility, and a consistently high standard of everyday experience.
Properties for Sale
Market Snapshot
Here's a snapshot of the real estate market in Naples as of April 2026. The median sales price for all property types in Naples was $640,000. Broken down, the median sales price for single-family homes was $855,000, while condos saw a median sales price of $450,900. Inventory levels in Naples continue to show strong availability. As of April 2026, there were 2,725 single-family homes and 3,154 condos available for sale, bringing the total to 5,906 properties on the market. The months' supply of homes for sale was 8.1 for all property types combined. This breaks down to 7.3 months' supply for single-family homes and 8.9 months for condos. Sales activity in Naples remains robust. In April 2026, there were 475 single-family home sales and 555 condo sales, totaling 996 transactions across all property types. Additionally, pending sales in April 2026 totaled 1,029, with 517 being single-family homes and 512 being condos. Finally, the median price per square foot for all property types in Naples was $347. This figure was derived from $396 per square foot for single-family homes and $292 per square foot for condos.
May 2026 · Last updated May 2, 2026
Pricing
Track how home values are trending in Naples. Median sale prices and price-per-square-foot data help buyers and sellers gauge current market positioning.
Median Closed Price
$595,000 as of June 2026, up 3.8% year-over-year.
View monthly data
| Month | Median Closed Price |
|---|---|
| July 2025 | $575,000 |
| August 2025 | $585,000 |
| September 2025 | $550,000 |
| October 2025 | $575,000 |
| November 2025 | $545,000 |
| December 2025 | $570,000 |
| January 2026 | $620,750 |
| February 2026 | $645,000 |
| March 2026 | $575,000 |
| April 2026 | $630,000 |
| May 2026 | $599,900 |
| June 2026 | $595,000 |
Source: Naples Area Board of REALTORS® (NABOR®) MLS, via InfoSparks. Data through June 2026. Data deemed reliable but not guaranteed.
Median Prices per Sq ft
$331 as of May 2026, down 0.3% year-over-year.
View monthly data
| Month | Median Prices per Sq ft |
|---|---|
| June 2025 | $329 |
| July 2025 | $315 |
| August 2025 | $315 |
| September 2025 | $316 |
| October 2025 | $323 |
| November 2025 | $318 |
| December 2025 | $319 |
| January 2026 | $338 |
| February 2026 | $336 |
| March 2026 | $323 |
| April 2026 | $340 |
| May 2026 | $331 |
Source: Naples Area Board of REALTORS® (NABOR®) MLS, via InfoSparks. Data through May 2026. Data deemed reliable but not guaranteed.
Median Closed Price
$595,000 as of June 2026, up 3.8% year-over-year.
View monthly data
| Month | Median Closed Price |
|---|---|
| July 2025 | $575,000 |
| August 2025 | $585,000 |
| September 2025 | $550,000 |
| October 2025 | $575,000 |
| November 2025 | $545,000 |
| December 2025 | $570,000 |
| January 2026 | $620,750 |
| February 2026 | $645,000 |
| March 2026 | $575,000 |
| April 2026 | $630,000 |
| May 2026 | $599,900 |
| June 2026 | $595,000 |
Source: Naples Area Board of REALTORS® (NABOR®) MLS, via InfoSparks. Data through June 2026. Data deemed reliable but not guaranteed.
$331 as of May 2026, down 0.3% year-over-year.
View monthly data
| Month | Median Prices per Sq ft |
|---|---|
| June 2025 | $329 |
| July 2025 | $315 |
| August 2025 | $315 |
| September 2025 | $316 |
| October 2025 | $323 |
| November 2025 | $318 |
| December 2025 | $319 |
| January 2026 | $338 |
| February 2026 | $336 |
| March 2026 | $323 |
| April 2026 | $340 |
| May 2026 | $331 |
Source: Naples Area Board of REALTORS® (NABOR®) MLS, via InfoSparks. Data through May 2026. Data deemed reliable but not guaranteed.
Inventory
See how many homes are available in Naples and how quickly inventory is moving. Months of supply indicates whether conditions favor buyers or sellers.
Homes For Sale
5,360 as of May 2026, down 21.1% year-over-year.
View monthly data
| Month | Homes For Sale |
|---|---|
| June 2025 | 6,189 |
| July 2025 | 5,585 |
| August 2025 | 5,249 |
| September 2025 | 5,124 |
| October 2025 | 5,623 |
| November 2025 | 5,963 |
| December 2025 | 5,896 |
| January 2026 | 6,517 |
| February 2026 | 6,633 |
| March 2026 | 6,495 |
| April 2026 | 6,015 |
| May 2026 | 5,360 |
Source: Naples Area Board of REALTORS® (NABOR®) MLS, via InfoSparks. Data through May 2026. Data deemed reliable but not guaranteed.
Months Supply
7.2 as of May 2026, down 32.1% year-over-year.
View monthly data
| Month | Months Supply |
|---|---|
| June 2025 | 9.7 |
| July 2025 | 8.7 |
| August 2025 | 8.1 |
| September 2025 | 7.8 |
| October 2025 | 8.4 |
| November 2025 | 8.9 |
| December 2025 | 8.6 |
| January 2026 | 9.5 |
| February 2026 | 9.5 |
| March 2026 | 9 |
| April 2026 | 8.2 |
| May 2026 | 7.2 |
Source: Naples Area Board of REALTORS® (NABOR®) MLS, via InfoSparks. Data through May 2026. Data deemed reliable but not guaranteed.
Homes For Sale
5,360 as of May 2026, down 21.1% year-over-year.
View monthly data
| Month | Homes For Sale |
|---|---|
| June 2025 | 6,189 |
| July 2025 | 5,585 |
| August 2025 | 5,249 |
| September 2025 | 5,124 |
| October 2025 | 5,623 |
| November 2025 | 5,963 |
| December 2025 | 5,896 |
| January 2026 | 6,517 |
| February 2026 | 6,633 |
| March 2026 | 6,495 |
| April 2026 | 6,015 |
| May 2026 | 5,360 |
Source: Naples Area Board of REALTORS® (NABOR®) MLS, via InfoSparks. Data through May 2026. Data deemed reliable but not guaranteed.
7.2 as of May 2026, down 32.1% year-over-year.
View monthly data
| Month | Months Supply |
|---|---|
| June 2025 | 9.7 |
| July 2025 | 8.7 |
| August 2025 | 8.1 |
| September 2025 | 7.8 |
| October 2025 | 8.4 |
| November 2025 | 8.9 |
| December 2025 | 8.6 |
| January 2026 | 9.5 |
| February 2026 | 9.5 |
| March 2026 | 9 |
| April 2026 | 8.2 |
| May 2026 | 7.2 |
Source: Naples Area Board of REALTORS® (NABOR®) MLS, via InfoSparks. Data through May 2026. Data deemed reliable but not guaranteed.
Activity
Monitor real estate transaction volume in Naples. Pending and closed sales reflect the pace of buyer demand and overall market momentum.
Pending Sales
844 as of May 2026, up 12.7% year-over-year.
View monthly data
| Month | Pending Sales |
|---|---|
| June 2025 | 578 |
| July 2025 | 621 |
| August 2025 | 602 |
| September 2025 | 605 |
| October 2025 | 660 |
| November 2025 | 683 |
| December 2025 | 562 |
| January 2026 | 887 |
| February 2026 | 1,058 |
| March 2026 | 1,088 |
| April 2026 | 1,002 |
| May 2026 | 844 |
Source: Naples Area Board of REALTORS® (NABOR®) MLS, via InfoSparks. Data through May 2026. Data deemed reliable but not guaranteed.
Total Sales
903 as of May 2026, up 14.3% year-over-year.
View monthly data
| Month | Total Sales |
|---|---|
| June 2025 | 756 |
| July 2025 | 640 |
| August 2025 | 615 |
| September 2025 | 608 |
| October 2025 | 673 |
| November 2025 | 510 |
| December 2025 | 776 |
| January 2026 | 572 |
| February 2026 | 732 |
| March 2026 | 1,061 |
| April 2026 | 1,073 |
| May 2026 | 903 |
Source: Naples Area Board of REALTORS® (NABOR®) MLS, via InfoSparks. Data through May 2026. Data deemed reliable but not guaranteed.
Pending Sales
844 as of May 2026, up 12.7% year-over-year.
View monthly data
| Month | Pending Sales |
|---|---|
| June 2025 | 578 |
| July 2025 | 621 |
| August 2025 | 602 |
| September 2025 | 605 |
| October 2025 | 660 |
| November 2025 | 683 |
| December 2025 | 562 |
| January 2026 | 887 |
| February 2026 | 1,058 |
| March 2026 | 1,088 |
| April 2026 | 1,002 |
| May 2026 | 844 |
Source: Naples Area Board of REALTORS® (NABOR®) MLS, via InfoSparks. Data through May 2026. Data deemed reliable but not guaranteed.
903 as of May 2026, up 14.3% year-over-year.
View monthly data
| Month | Total Sales |
|---|---|
| June 2025 | 756 |
| July 2025 | 640 |
| August 2025 | 615 |
| September 2025 | 608 |
| October 2025 | 673 |
| November 2025 | 510 |
| December 2025 | 776 |
| January 2026 | 572 |
| February 2026 | 732 |
| March 2026 | 1,061 |
| April 2026 | 1,073 |
| May 2026 | 903 |
Source: Naples Area Board of REALTORS® (NABOR®) MLS, via InfoSparks. Data through May 2026. Data deemed reliable but not guaranteed.
Communities & Areas in Naples
area Bundled Golf
Naples • East Naples
Foxfire Country Club
Gated bundled golf community in Naples with 27 holes of Arthur Hills–designed golf and resort-style amenities close to downtown and the beaches.
Gated~$225k – $1.2M+
 Bundled Golf
Naples • Central Naples
High Point Country Club
Affordable, walkable bundled golf condo community in central Naples with a par-3 course and six pools minutes from the beach.
Not gated~$200k – $550k+