Livingston Woods
None; no community association
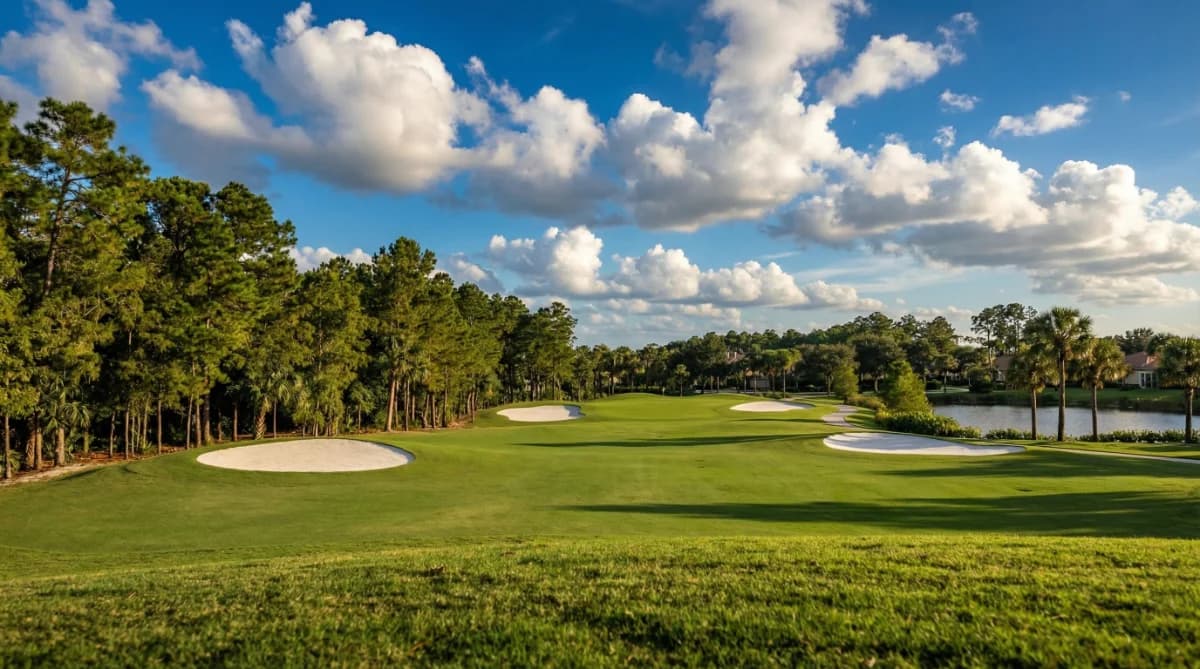
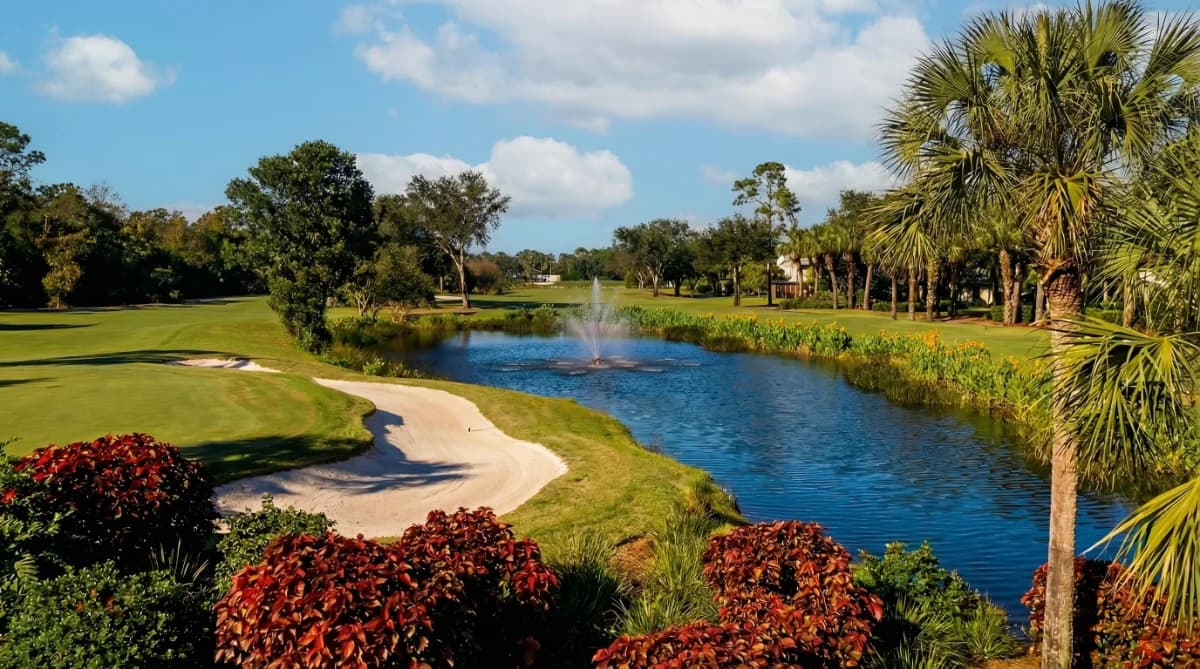
Livingston Woods is about 240 detached houses on acreage lots off Livingston Road, north of Pine Ridge Road. The lots average 2.73 acres and half of them are 2.50 acres or larger. This is unincorporated Collier County, and no city line reaches it: Naples, Marco Island and Everglades City are the county's only three municipalities.
The fact that decides most of a purchase here is an absence: no community association governs or bills these homes. That means no approval to buy, no monthly or quarterly dues, and no architectural review committee to apply to. There is no association budget and no reserve study to read before closing. There's no gate either, and no gatehouse, because there's no association that could own or staff one. Where a listing mentions a gate, it's a gate across one property's own driveway. The streets themselves just run out to Livingston Road and Pine Ridge Road.
Why isn't Livingston Woods a subdivision?
Because no plat of that name exists. Collier County's index of subdivisions and condominiums holds 4,497 entries and Livingston Woods is not one of them. Most of the houses sit on land the county calls "GOLDEN GATE EST UNIT 35", a 1960s acreage plat. The rest is unplatted acreage, or sits in one of five small re-plats. Those are named Livingston Meadow in Unit 35, Hunters Woods, Oak Haven, Cross Acres and Bernier Estate. Livingston Woods is a locality name laid over the top of all that. No developer laid it out, and no single document governs it.
What decides what you can build or keep on the land?
Collier County zoning does. All 240 houses stand on land the county zones Estates, and that zoning is what governs the lot. With no architectural review committee in the picture, the county is the body you deal with. It decides the buildings, the animals and the home occupations a lot may carry. If the reason you want acreage is to put something on it, check the plan against the county's Land Development Code first.
Working land is part of the picture here. Two lots hold a county agricultural classification, one for poultry, bees and tropical fish, the other for ornamentals and miscellaneous agriculture, and both sit on Estates-zoned land. Outbuildings are ordinary too: the county's building map counts 616 structures against 240 houses, and guest houses, detached garages, workshops and barns make up the difference.
How much do houses cost in Livingston Woods?
Two prices, on one kind of house. Existing houses, built between 1974 and 2015, have mostly sold from around $1.6 million to around $2.5 million, and newly built houses are asked far above that band. Nothing about the property type tells the two apart, because a detached house is all there is here. One range across both tiers would describe neither.
Houses run from about 1850 to about 7700 square feet, and bedroom counts start at 3 and reach 6. No condominiums, no attached villas, no mobile homes.
Is Livingston Woods built out?
No, and there is no year at which it will be. 240 houses stand here, and 27 lots have no house on them at all. That's 19 vacant residential lots and 8 larger acreage lots without a dwelling. Building has gone on without a break for five decades, from 13 houses completed in the 1970s to 24 since 2020. The heaviest building came in the 1980s, and houses finished in 2026 stand among them. So a house here can be brand new or half a century old, and both are Livingston Woods.
What should you settle before making an offer?
- The water supply and the waste-water arrangement at that exact address. On an acreage lot it drives running costs, and it decides what a sensible inspection covers.
- What Estates zoning allows for the plan you have in mind, whether that is a barn, a guest house or a workshop.
- The acreage of the lot itself. Lots here run from 0.87 acres up to 7.53.
- What each structure on the lot actually is, and whether it stays with the sale.
Roughly 638 acres, 240 houses, and nothing standing between them that collects a dollar or approves a paint color. A couple of dozen lots still have no house on them, and what goes up on each of those is a matter between the owner and Collier County.
Quick Facts
- Home Prices
- Resales mostly $1.6M – $2.5M; new builds higher
- Monthly Fees
- None; no community association
- Initiation Fee
- No initiation fee
- Gated
- No
- Residences
- About 240 detached houses on acreage lots
- Location
- Off Livingston Road, north of Pine Ridge Road; unincorporated
- Lots
- Median 2.50 acres; most between 1.5 and 5 acres
- Built
- Continuously since the 1970s; not built out
- Home Sizes
- About 1,850–7,700 sq ft
- Bedrooms
- 3–6
Properties for Sale
Market Snapshot
The median closed price for single-family homes in Livingston Woods, North Naples, was $1,775,000 in September 2026, which is down from $2,450,000 a year earlier, according to NABOR MLS data through September 2026. The median price per square foot for single-family homes was $701 in September 2026, compared to $545 in September 2023. August 2026 saw a high median closed price of $5,575,000 for single-family homes, based on 2 closed sales. Inventory of single-family homes in Livingston Woods stood at 11 in September 2026, an increase from 4 homes in September 2025. This rise in available homes has contributed to an increase in the months supply of inventory. In September 2026, the months supply for single-family homes was 7.3, up from 2.7 in September 2025, suggesting more options for buyers and a shift towards a more balanced market. Sales activity for single-family homes was limited, with 1 closed sale in September 2026, matching the 1 closed sale in September 2023. Pending sales for single-family homes were 2 in September 2026. Over the past year, the number of closed sales has fluctuated significantly, with 2 closed sales in August 2026 and 1 closed sale in March 2026, based on a small number of transactions.
October 2026 · Last updated Oct 2, 2026
Pricing
Track how home values are trending in Livingston Woods. Median sale prices and price-per-square-foot data help buyers and sellers gauge current market positioning.
Median Closed Price
$1,775,000 as of September 2026.
View monthly data
| Month | Median Closed Price |
|---|---|
| May 2024 | $1,600,000 |
| August 2024 | $3,250,000 |
| January 2025 | $4,425,000 |
| February 2025 | $800,000 |
| March 2025 | $2,150,000 |
| April 2025 | $1,824,500 |
| May 2025 | $2,100,000 |
| July 2025 | $2,050,000 |
| March 2026 | $1,850,000 |
| July 2026 | $2,087,500 |
| August 2026 | $5,575,000 |
| September 2026 | $1,775,000 |
Source: Naples Area Board of REALTORS® (NABOR®) MLS, via InfoSparks. Data through September 2026. Data deemed reliable but not guaranteed.
Median Prices per Sq ft
$701 as of September 2026.
View monthly data
| Month | Median Prices per Sq ft |
|---|---|
| May 2024 | $752 |
| August 2024 | $1,078 |
| January 2025 | $836 |
| February 2025 | $480 |
| March 2025 | $863 |
| April 2025 | $855 |
| May 2025 | $1,125 |
| July 2025 | $794 |
| March 2026 | $865 |
| July 2026 | $757 |
| August 2026 | $862 |
| September 2026 | $701 |
Source: Naples Area Board of REALTORS® (NABOR®) MLS, via InfoSparks. Data through September 2026. Data deemed reliable but not guaranteed.
Median Closed Price
$1,775,000 as of September 2026.
View monthly data
| Month | Median Closed Price |
|---|---|
| May 2024 | $1,600,000 |
| August 2024 | $3,250,000 |
| January 2025 | $4,425,000 |
| February 2025 | $800,000 |
| March 2025 | $2,150,000 |
| April 2025 | $1,824,500 |
| May 2025 | $2,100,000 |
| July 2025 | $2,050,000 |
| March 2026 | $1,850,000 |
| July 2026 | $2,087,500 |
| August 2026 | $5,575,000 |
| September 2026 | $1,775,000 |
Source: Naples Area Board of REALTORS® (NABOR®) MLS, via InfoSparks. Data through September 2026. Data deemed reliable but not guaranteed.
$701 as of September 2026.
View monthly data
| Month | Median Prices per Sq ft |
|---|---|
| May 2024 | $752 |
| August 2024 | $1,078 |
| January 2025 | $836 |
| February 2025 | $480 |
| March 2025 | $863 |
| April 2025 | $855 |
| May 2025 | $1,125 |
| July 2025 | $794 |
| March 2026 | $865 |
| July 2026 | $757 |
| August 2026 | $862 |
| September 2026 | $701 |
Source: Naples Area Board of REALTORS® (NABOR®) MLS, via InfoSparks. Data through September 2026. Data deemed reliable but not guaranteed.
Inventory
See how many homes are available in Livingston Woods and how quickly inventory is moving. Months of supply indicates whether conditions favor buyers or sellers.
Homes For Sale
10 as of September 2026, up 150.0% year-over-year.
View monthly data
| Month | Homes For Sale |
|---|---|
| October 2025 | 6 |
| November 2025 | 10 |
| December 2025 | 11 |
| January 2026 | 14 |
| February 2026 | 16 |
| March 2026 | 15 |
| April 2026 | 17 |
| May 2026 | 18 |
| June 2026 | 17 |
| July 2026 | 14 |
| August 2026 | 13 |
| September 2026 | 10 |
Source: Naples Area Board of REALTORS® (NABOR®) MLS, via InfoSparks. Data through September 2026. Data deemed reliable but not guaranteed.
Months Supply
6.7 as of September 2026, up 148.1% year-over-year.
View monthly data
| Month | Months Supply |
|---|---|
| October 2025 | 4 |
| November 2025 | 6.7 |
| December 2025 | 7.3 |
| January 2026 | 10 |
| February 2026 | 10.7 |
| March 2026 | 10 |
| April 2026 | 12.8 |
| May 2026 | 12 |
| June 2026 | 11.3 |
| July 2026 | 9.3 |
| August 2026 | 7.8 |
| September 2026 | 6.7 |
Source: Naples Area Board of REALTORS® (NABOR®) MLS, via InfoSparks. Data through September 2026. Data deemed reliable but not guaranteed.
Homes For Sale
10 as of September 2026, up 150.0% year-over-year.
View monthly data
| Month | Homes For Sale |
|---|---|
| October 2025 | 6 |
| November 2025 | 10 |
| December 2025 | 11 |
| January 2026 | 14 |
| February 2026 | 16 |
| March 2026 | 15 |
| April 2026 | 17 |
| May 2026 | 18 |
| June 2026 | 17 |
| July 2026 | 14 |
| August 2026 | 13 |
| September 2026 | 10 |
Source: Naples Area Board of REALTORS® (NABOR®) MLS, via InfoSparks. Data through September 2026. Data deemed reliable but not guaranteed.
6.7 as of September 2026, up 148.1% year-over-year.
View monthly data
| Month | Months Supply |
|---|---|
| October 2025 | 4 |
| November 2025 | 6.7 |
| December 2025 | 7.3 |
| January 2026 | 10 |
| February 2026 | 10.7 |
| March 2026 | 10 |
| April 2026 | 12.8 |
| May 2026 | 12 |
| June 2026 | 11.3 |
| July 2026 | 9.3 |
| August 2026 | 7.8 |
| September 2026 | 6.7 |
Source: Naples Area Board of REALTORS® (NABOR®) MLS, via InfoSparks. Data through September 2026. Data deemed reliable but not guaranteed.
Activity
Monitor real estate transaction volume in Livingston Woods. Pending and closed sales reflect the pace of buyer demand and overall market momentum.
Pending Sales
3 as of September 2026.
View monthly data
| Month | Pending Sales |
|---|---|
| October 2025 | 0 |
| November 2025 | 0 |
| December 2025 | 0 |
| January 2026 | 0 |
| February 2026 | 0 |
| March 2026 | 1 |
| April 2026 | 0 |
| May 2026 | 0 |
| June 2026 | 1 |
| July 2026 | 4 |
| August 2026 | 0 |
| September 2026 | 3 |
Source: Naples Area Board of REALTORS® (NABOR®) MLS, via InfoSparks. Data through September 2026. Data deemed reliable but not guaranteed.
Total Sales
1 as of September 2026.
View monthly data
| Month | Total Sales |
|---|---|
| October 2025 | 0 |
| November 2025 | 0 |
| December 2025 | 0 |
| January 2026 | 0 |
| February 2026 | 0 |
| March 2026 | 1 |
| April 2026 | 0 |
| May 2026 | 0 |
| June 2026 | 0 |
| July 2026 | 2 |
| August 2026 | 2 |
| September 2026 | 1 |
Source: Naples Area Board of REALTORS® (NABOR®) MLS, via InfoSparks. Data through September 2026. Data deemed reliable but not guaranteed.
Pending Sales
3 as of September 2026.
View monthly data
| Month | Pending Sales |
|---|---|
| October 2025 | 0 |
| November 2025 | 0 |
| December 2025 | 0 |
| January 2026 | 0 |
| February 2026 | 0 |
| March 2026 | 1 |
| April 2026 | 0 |
| May 2026 | 0 |
| June 2026 | 1 |
| July 2026 | 4 |
| August 2026 | 0 |
| September 2026 | 3 |
Source: Naples Area Board of REALTORS® (NABOR®) MLS, via InfoSparks. Data through September 2026. Data deemed reliable but not guaranteed.
1 as of September 2026.
View monthly data
| Month | Total Sales |
|---|---|
| October 2025 | 0 |
| November 2025 | 0 |
| December 2025 | 0 |
| January 2026 | 0 |
| February 2026 | 0 |
| March 2026 | 1 |
| April 2026 | 0 |
| May 2026 | 0 |
| June 2026 | 0 |
| July 2026 | 2 |
| August 2026 | 2 |
| September 2026 | 1 |
Source: Naples Area Board of REALTORS® (NABOR®) MLS, via InfoSparks. Data through September 2026. Data deemed reliable but not guaranteed.