Olde Cypress
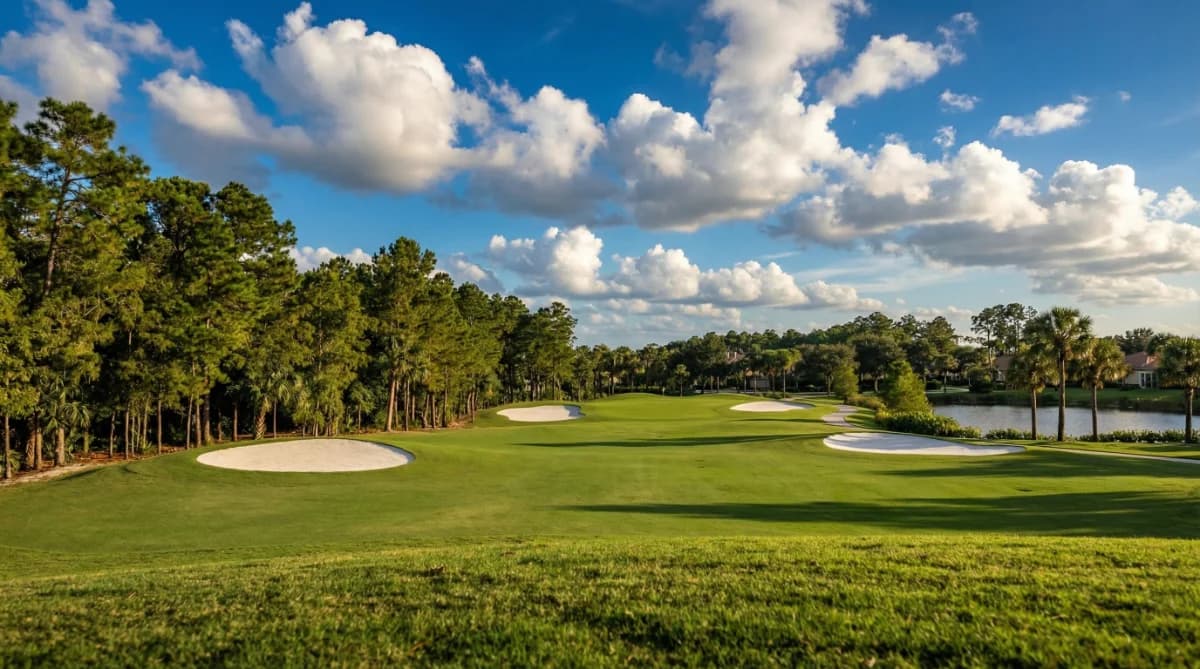
Olde Cypress is a private, guard-gated golf community set across 540 acres in North Naples, where more than 200 acres of native pine and cypress preserves create a lush, low-density setting for approximately 550 single-family homes and villas. The Club at Olde Cypress has positioned itself as one of North Naples most vibrant private clubs, anchored by P.B. The 18-hole championship course has a challenging layout known for its undulating fairways, pot bunkers, and elevated greens.
Clubhouse & Amenities
The community recently completed a $17M clubhouse renovation, expanding the 34,000-square-foot facility by an additional 10,000 square feet of indoor and outdoor space. The expanded club features a wraparound bar, wine and private dining room, covered outdoor dining with fire pits, and a new first-floor kitchen. Beyond golf, members enjoy Har-Tru tennis courts, pickleball, bocce, a resort-style pool and spa, a fitness center, and a packed social calendar.
Membership
Every home purchase includes a social membership with no initiation fee. Golf membership is optional and highly sought after.
Location & Convenience
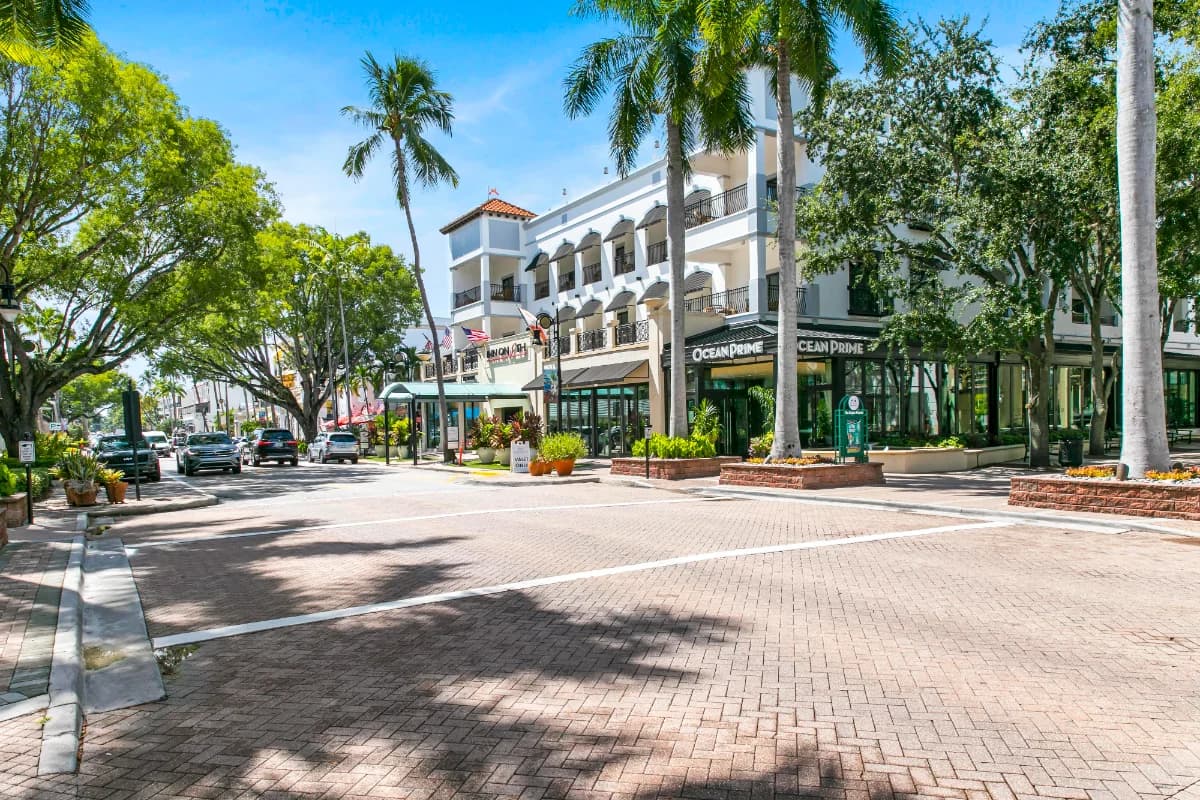
Located just off Immokalee Road with direct I-75 access, Olde Cypress is minutes from Logan Landings, Founders Square, Seed to Table, and Mercato, with Delnor-Wiggins Pass State Park roughly seven miles west.
Quick Facts
- Location
- North Naples
- Lifestyle
- Private club with golf, racquet sports & social calendar
- Golf
- 18-hole P.B. Dye championship course
- Memberships
- Multiple membership opportunities available
Properties for Sale
Market Snapshot
The median price per square foot in Olde Cypress, North Naples was not available in September 2026, according to NABOR MLS data through September 2026. This metric was $426 in September 2025, which itself was a decline from $569 in September 2024. The median closed price was also not available in September 2026. The most recent median closed price available was $1,350,000 in August 2026, which was up from $1,500,000 in July 2025, based on a small sample of transactions. Total sales activity in Olde Cypress showed no closed sales in September 2026, which was consistent with September 2025. This figure was also zero in June 2026, July 2026, and August 2026. The highest number of total sales in the past year occurred in March 2026 with 4 closed sales. Pending sales were 1 in September 2026, down from 0 in August 2026 and July 2026. Inventory and supply metrics indicate a months supply of homes for sale of 2.1 in September 2026, an increase from 1.8 months in August 2026. This is consistent with the 2.1 months supply recorded in September 2025. Homes for sale in Olde Cypress were 5 in September 2026, which is an increase from 4 homes for sale in August 2026 and an increase from 5 homes for sale in September 2025. These figures reflect a relatively limited market.
October 2026 · Last updated Oct 2, 2026
Pricing
Track how home values are trending in Olde Cypress. Median sale prices and price-per-square-foot data help buyers and sellers gauge current market positioning.
Median Closed Price
$1,350,000 as of August 2026, down 7.2% year-over-year.
View monthly data
| Month | Median Closed Price |
|---|---|
| August 2025 | $1,455,000 |
| September 2025 | $1,175,000 |
| October 2025 | $630,000 |
| November 2025 | $1,012,500 |
| December 2025 | $1,293,750 |
| January 2026 | $1,400,000 |
| February 2026 | $1,099,000 |
| March 2026 | $1,365,000 |
| April 2026 | $1,432,500 |
| May 2026 | $1,100,000 |
| July 2026 | $860,000 |
| August 2026 | $1,350,000 |
Source: Naples Area Board of REALTORS® (NABOR®) MLS, via InfoSparks. Data through August 2026. Data deemed reliable but not guaranteed.
Median Prices per Sq ft
$580 as of August 2026, up 3.4% year-over-year.
View monthly data
| Month | Median Prices per Sq ft |
|---|---|
| August 2025 | $561 |
| September 2025 | $426 |
| October 2025 | $313 |
| November 2025 | $405 |
| December 2025 | $467 |
| January 2026 | $541 |
| February 2026 | $436 |
| March 2026 | $538 |
| April 2026 | $483 |
| May 2026 | $470 |
| July 2026 | $475 |
| August 2026 | $580 |
Source: Naples Area Board of REALTORS® (NABOR®) MLS, via InfoSparks. Data through August 2026. Data deemed reliable but not guaranteed.
Median Closed Price
$1,350,000 as of August 2026, down 7.2% year-over-year.
View monthly data
| Month | Median Closed Price |
|---|---|
| August 2025 | $1,455,000 |
| September 2025 | $1,175,000 |
| October 2025 | $630,000 |
| November 2025 | $1,012,500 |
| December 2025 | $1,293,750 |
| January 2026 | $1,400,000 |
| February 2026 | $1,099,000 |
| March 2026 | $1,365,000 |
| April 2026 | $1,432,500 |
| May 2026 | $1,100,000 |
| July 2026 | $860,000 |
| August 2026 | $1,350,000 |
Source: Naples Area Board of REALTORS® (NABOR®) MLS, via InfoSparks. Data through August 2026. Data deemed reliable but not guaranteed.
$580 as of August 2026, up 3.4% year-over-year.
View monthly data
| Month | Median Prices per Sq ft |
|---|---|
| August 2025 | $561 |
| September 2025 | $426 |
| October 2025 | $313 |
| November 2025 | $405 |
| December 2025 | $467 |
| January 2026 | $541 |
| February 2026 | $436 |
| March 2026 | $538 |
| April 2026 | $483 |
| May 2026 | $470 |
| July 2026 | $475 |
| August 2026 | $580 |
Source: Naples Area Board of REALTORS® (NABOR®) MLS, via InfoSparks. Data through August 2026. Data deemed reliable but not guaranteed.
Inventory
See how many homes are available in Olde Cypress and how quickly inventory is moving. Months of supply indicates whether conditions favor buyers or sellers.
Homes For Sale
5 as of September 2026, up 0.0% year-over-year.
View monthly data
| Month | Homes For Sale |
|---|---|
| October 2025 | 6 |
| November 2025 | 8 |
| December 2025 | 7 |
| January 2026 | 9 |
| February 2026 | 11 |
| March 2026 | 6 |
| April 2026 | 5 |
| May 2026 | 6 |
| June 2026 | 5 |
| July 2026 | 5 |
| August 2026 | 4 |
| September 2026 | 5 |
Source: Naples Area Board of REALTORS® (NABOR®) MLS, via InfoSparks. Data through September 2026. Data deemed reliable but not guaranteed.
Months Supply
2.1 as of September 2026, up 0.0% year-over-year.
View monthly data
| Month | Months Supply |
|---|---|
| October 2025 | 2.6 |
| November 2025 | 3.4 |
| December 2025 | 2.7 |
| January 2026 | 3.4 |
| February 2026 | 3.9 |
| March 2026 | 2 |
| April 2026 | 2 |
| May 2026 | 2.5 |
| June 2026 | 2 |
| July 2026 | 2 |
| August 2026 | 1.8 |
| September 2026 | 2.1 |
Source: Naples Area Board of REALTORS® (NABOR®) MLS, via InfoSparks. Data through September 2026. Data deemed reliable but not guaranteed.
Homes For Sale
5 as of September 2026, up 0.0% year-over-year.
View monthly data
| Month | Homes For Sale |
|---|---|
| October 2025 | 6 |
| November 2025 | 8 |
| December 2025 | 7 |
| January 2026 | 9 |
| February 2026 | 11 |
| March 2026 | 6 |
| April 2026 | 5 |
| May 2026 | 6 |
| June 2026 | 5 |
| July 2026 | 5 |
| August 2026 | 4 |
| September 2026 | 5 |
Source: Naples Area Board of REALTORS® (NABOR®) MLS, via InfoSparks. Data through September 2026. Data deemed reliable but not guaranteed.
2.1 as of September 2026, up 0.0% year-over-year.
View monthly data
| Month | Months Supply |
|---|---|
| October 2025 | 2.6 |
| November 2025 | 3.4 |
| December 2025 | 2.7 |
| January 2026 | 3.4 |
| February 2026 | 3.9 |
| March 2026 | 2 |
| April 2026 | 2 |
| May 2026 | 2.5 |
| June 2026 | 2 |
| July 2026 | 2 |
| August 2026 | 1.8 |
| September 2026 | 2.1 |
Source: Naples Area Board of REALTORS® (NABOR®) MLS, via InfoSparks. Data through September 2026. Data deemed reliable but not guaranteed.
Activity
Monitor real estate transaction volume in Olde Cypress. Pending and closed sales reflect the pace of buyer demand and overall market momentum.
Pending Sales
1 as of September 2026.
View monthly data
| Month | Pending Sales |
|---|---|
| October 2025 | 3 |
| November 2025 | 5 |
| December 2025 | 2 |
| January 2026 | 2 |
| February 2026 | 3 |
| March 2026 | 5 |
| April 2026 | 3 |
| May 2026 | 0 |
| June 2026 | 0 |
| July 2026 | 0 |
| August 2026 | 0 |
| September 2026 | 1 |
Source: Naples Area Board of REALTORS® (NABOR®) MLS, via InfoSparks. Data through September 2026. Data deemed reliable but not guaranteed.
Total Sales
0 as of September 2026, down 100.0% year-over-year.
View monthly data
| Month | Total Sales |
|---|---|
| October 2025 | 1 |
| November 2025 | 2 |
| December 2025 | 4 |
| January 2026 | 3 |
| February 2026 | 3 |
| March 2026 | 4 |
| April 2026 | 2 |
| May 2026 | 3 |
| June 2026 | 0 |
| July 2026 | 1 |
| August 2026 | 1 |
| September 2026 | 0 |
Source: Naples Area Board of REALTORS® (NABOR®) MLS, via InfoSparks. Data through September 2026. Data deemed reliable but not guaranteed.
Pending Sales
1 as of September 2026.
View monthly data
| Month | Pending Sales |
|---|---|
| October 2025 | 3 |
| November 2025 | 5 |
| December 2025 | 2 |
| January 2026 | 2 |
| February 2026 | 3 |
| March 2026 | 5 |
| April 2026 | 3 |
| May 2026 | 0 |
| June 2026 | 0 |
| July 2026 | 0 |
| August 2026 | 0 |
| September 2026 | 1 |
Source: Naples Area Board of REALTORS® (NABOR®) MLS, via InfoSparks. Data through September 2026. Data deemed reliable but not guaranteed.
0 as of September 2026, down 100.0% year-over-year.
View monthly data
| Month | Total Sales |
|---|---|
| October 2025 | 1 |
| November 2025 | 2 |
| December 2025 | 4 |
| January 2026 | 3 |
| February 2026 | 3 |
| March 2026 | 4 |
| April 2026 | 2 |
| May 2026 | 3 |
| June 2026 | 0 |
| July 2026 | 1 |
| August 2026 | 1 |
| September 2026 | 0 |
Source: Naples Area Board of REALTORS® (NABOR®) MLS, via InfoSparks. Data through September 2026. Data deemed reliable but not guaranteed.