 Bundled Golf
Naples • North Naples
Vanderbilt Country Club
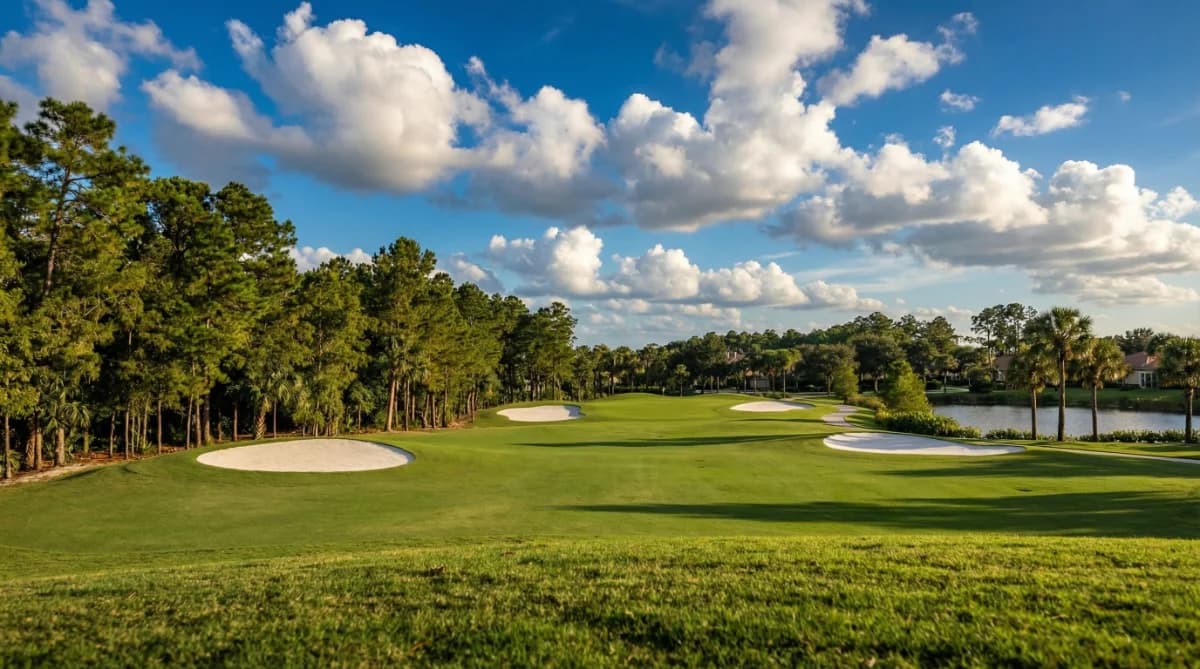
Bundled golf community in North Naples with 18-hole golf, fitness & spa, resort-style pool, and active club lifestyle.
Gated~$350k – $1.4M+
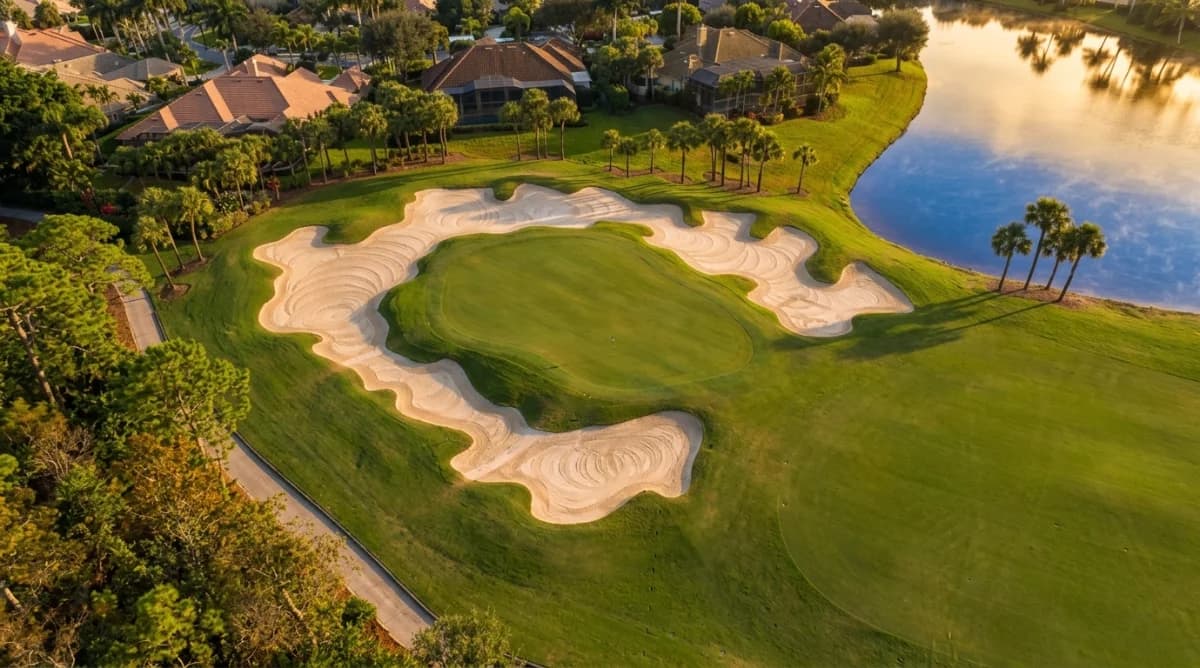
Pelican Marsh is a gated master-planned community in North Naples known for its mature landscaping, central location, and well-established residential neighborhoods. The community offers a mix of single-family homes, villas, and condominiums arranged around natural preserves and golf course views.
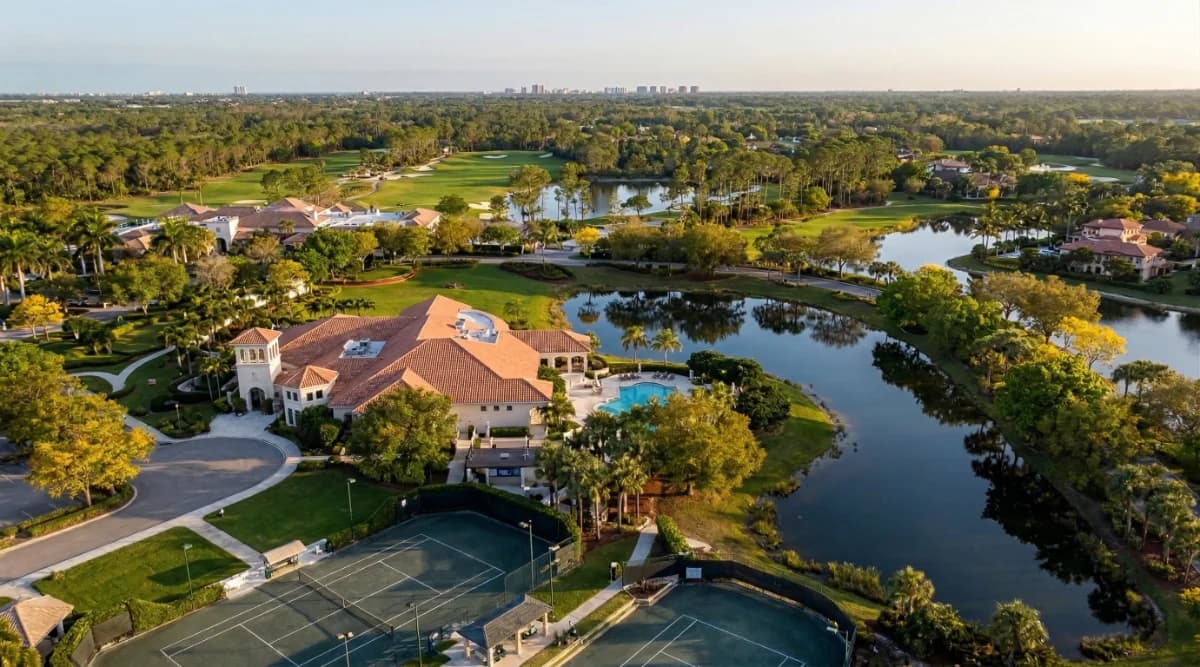
At the center of Pelican Marsh is The Community Center, offering tennis, pickleball, fitness facilities, and a variety of social programs. The private golf club provides an 18-hole championship course, designed to integrate with the natural terrain and surrounding preserves.
Located just minutes from Vanderbilt Beach, Mercato, and Waterside Shops, Pelican Marsh offers one of the most convenient addresses in North Naples. The lifestyle is defined by a balance of privacy, amenities, and proximity to everyday conveniences and coastal destinations.
The Pelican Marsh real estate market in North Naples saw a median sales price of $985,000 in April 2026 across all property types. Recent median sales prices have fluctuated, with a high of $2,300,000 in March 2026 and a low of $765,000 that same month. Single-family homes and condos both contribute to these figures, with condos showing more consistent sales prices in recent months. Inventory levels in Pelican Marsh remain elevated. In April 2026, there were 49 homes for sale (21 single-family, 28 condos). This is down from a high of 61 total properties for sale in January 2026. The months' supply of homes for sale was 5.9 for all property types in April 2026. Sales activity in Pelican Marsh is moderate. There were 14 pending sales and 20 total sales in April 2026. These figures are up noticeably from June and July of 2025, which each saw only 2 total sales. The median price per square foot for all property types was $487 in April 2026, up from $431 in March 2026.
May 2026 · Last updated May 2, 2026
Track how home values are trending in Pelican Marsh. Median sale prices and price-per-square-foot data help buyers and sellers gauge current market positioning.
Median Closed Price
$845,000 as of June 2026, up 7.0% year-over-year.
| Month | Median Closed Price |
|---|---|
| July 2025 | $1,075,000 |
| August 2025 | $687,500 |
| September 2025 | $675,000 |
| October 2025 | $720,000 |
| November 2025 | $850,000 |
| December 2025 | $1,925,000 |
| January 2026 | $975,000 |
| February 2026 | $995,000 |
| March 2026 | $765,000 |
| April 2026 | $985,000 |
| May 2026 | $950,000 |
| June 2026 | $845,000 |
Source: Naples Area Board of REALTORS® (NABOR®) MLS, via InfoSparks. Data through June 2026. Data deemed reliable but not guaranteed.
Median Prices per Sq ft
$402 as of June 2026, down 8.8% year-over-year.
| Month | Median Prices per Sq ft |
|---|---|
| July 2025 | $522 |
| August 2025 | $365 |
| September 2025 | $364 |
| October 2025 | $395 |
| November 2025 | $494 |
| December 2025 | $629 |
| January 2026 | $427 |
| February 2026 | $472 |
| March 2026 | $431 |
| April 2026 | $487 |
| May 2026 | $449 |
| June 2026 | $402 |
Source: Naples Area Board of REALTORS® (NABOR®) MLS, via InfoSparks. Data through June 2026. Data deemed reliable but not guaranteed.
Median Closed Price
$845,000 as of June 2026, up 7.0% year-over-year.
| Month | Median Closed Price |
|---|---|
| July 2025 | $1,075,000 |
| August 2025 | $687,500 |
| September 2025 | $675,000 |
| October 2025 | $720,000 |
| November 2025 | $850,000 |
| December 2025 | $1,925,000 |
| January 2026 | $975,000 |
| February 2026 | $995,000 |
| March 2026 | $765,000 |
| April 2026 | $985,000 |
| May 2026 | $950,000 |
| June 2026 | $845,000 |
Source: Naples Area Board of REALTORS® (NABOR®) MLS, via InfoSparks. Data through June 2026. Data deemed reliable but not guaranteed.
$402 as of June 2026, down 8.8% year-over-year.
| Month | Median Prices per Sq ft |
|---|---|
| July 2025 | $522 |
| August 2025 | $365 |
| September 2025 | $364 |
| October 2025 | $395 |
| November 2025 | $494 |
| December 2025 | $629 |
| January 2026 | $427 |
| February 2026 | $472 |
| March 2026 | $431 |
| April 2026 | $487 |
| May 2026 | $449 |
| June 2026 | $402 |
Source: Naples Area Board of REALTORS® (NABOR®) MLS, via InfoSparks. Data through June 2026. Data deemed reliable but not guaranteed.
See how many homes are available in Pelican Marsh and how quickly inventory is moving. Months of supply indicates whether conditions favor buyers or sellers.
Homes For Sale
30 as of June 2026, down 30.2% year-over-year.
| Month | Homes For Sale |
|---|---|
| July 2025 | 40 |
| August 2025 | 36 |
| September 2025 | 38 |
| October 2025 | 49 |
| November 2025 | 54 |
| December 2025 | 59 |
| January 2026 | 61 |
| February 2026 | 60 |
| March 2026 | 59 |
| April 2026 | 51 |
| May 2026 | 39 |
| June 2026 | 30 |
Source: Naples Area Board of REALTORS® (NABOR®) MLS, via InfoSparks. Data through June 2026. Data deemed reliable but not guaranteed.
Months Supply
3.2 as of June 2026, down 49.2% year-over-year.
| Month | Months Supply |
|---|---|
| July 2025 | 6.4 |
| August 2025 | 5.8 |
| September 2025 | 6 |
| October 2025 | 7.5 |
| November 2025 | 8.4 |
| December 2025 | 9.1 |
| January 2026 | 9.2 |
| February 2026 | 8.2 |
| March 2026 | 8 |
| April 2026 | 6.1 |
| May 2026 | 4.4 |
| June 2026 | 3.2 |
Source: Naples Area Board of REALTORS® (NABOR®) MLS, via InfoSparks. Data through June 2026. Data deemed reliable but not guaranteed.
Homes For Sale
30 as of June 2026, down 30.2% year-over-year.
| Month | Homes For Sale |
|---|---|
| July 2025 | 40 |
| August 2025 | 36 |
| September 2025 | 38 |
| October 2025 | 49 |
| November 2025 | 54 |
| December 2025 | 59 |
| January 2026 | 61 |
| February 2026 | 60 |
| March 2026 | 59 |
| April 2026 | 51 |
| May 2026 | 39 |
| June 2026 | 30 |
Source: Naples Area Board of REALTORS® (NABOR®) MLS, via InfoSparks. Data through June 2026. Data deemed reliable but not guaranteed.
3.2 as of June 2026, down 49.2% year-over-year.
| Month | Months Supply |
|---|---|
| July 2025 | 6.4 |
| August 2025 | 5.8 |
| September 2025 | 6 |
| October 2025 | 7.5 |
| November 2025 | 8.4 |
| December 2025 | 9.1 |
| January 2026 | 9.2 |
| February 2026 | 8.2 |
| March 2026 | 8 |
| April 2026 | 6.1 |
| May 2026 | 4.4 |
| June 2026 | 3.2 |
Source: Naples Area Board of REALTORS® (NABOR®) MLS, via InfoSparks. Data through June 2026. Data deemed reliable but not guaranteed.
Monitor real estate transaction volume in Pelican Marsh. Pending and closed sales reflect the pace of buyer demand and overall market momentum.
Pending Sales
7 as of June 2026, up 250.0% year-over-year.
| Month | Pending Sales |
|---|---|
| July 2025 | 2 |
| August 2025 | 6 |
| September 2025 | 4 |
| October 2025 | 5 |
| November 2025 | 9 |
| December 2025 | 11 |
| January 2026 | 17 |
| February 2026 | 21 |
| March 2026 | 11 |
| April 2026 | 13 |
| May 2026 | 9 |
| June 2026 | 7 |
Source: Naples Area Board of REALTORS® (NABOR®) MLS, via InfoSparks. Data through June 2026. Data deemed reliable but not guaranteed.
Total Sales
11 as of May 2026, up 120.0% year-over-year.
| Month | Total Sales |
|---|---|
| June 2025 | 9 |
| July 2025 | 4 |
| August 2025 | 2 |
| September 2025 | 7 |
| October 2025 | 3 |
| November 2025 | 3 |
| December 2025 | 6 |
| January 2026 | 11 |
| February 2026 | 18 |
| March 2026 | 12 |
| April 2026 | 20 |
| May 2026 | 11 |
Source: Naples Area Board of REALTORS® (NABOR®) MLS, via InfoSparks. Data through May 2026. Data deemed reliable but not guaranteed.
Pending Sales
7 as of June 2026, up 250.0% year-over-year.
| Month | Pending Sales |
|---|---|
| July 2025 | 2 |
| August 2025 | 6 |
| September 2025 | 4 |
| October 2025 | 5 |
| November 2025 | 9 |
| December 2025 | 11 |
| January 2026 | 17 |
| February 2026 | 21 |
| March 2026 | 11 |
| April 2026 | 13 |
| May 2026 | 9 |
| June 2026 | 7 |
Source: Naples Area Board of REALTORS® (NABOR®) MLS, via InfoSparks. Data through June 2026. Data deemed reliable but not guaranteed.
11 as of May 2026, up 120.0% year-over-year.
| Month | Total Sales |
|---|---|
| June 2025 | 9 |
| July 2025 | 4 |
| August 2025 | 2 |
| September 2025 | 7 |
| October 2025 | 3 |
| November 2025 | 3 |
| December 2025 | 6 |
| January 2026 | 11 |
| February 2026 | 18 |
| March 2026 | 12 |
| April 2026 | 20 |
| May 2026 | 11 |
Source: Naples Area Board of REALTORS® (NABOR®) MLS, via InfoSparks. Data through May 2026. Data deemed reliable but not guaranteed.
Bundled GolfBundled golf community in North Naples with 18-hole golf, fitness & spa, resort-style pool, and active club lifestyle.
 community
Private golf community in Naples featuring two Tom Fazio courses, beach club, and new sports center.
Exclusive private golf club in Naples featuring a Robert von Hagge championship course and sophisticated dining.
Bundled GolfBundled golf community in North Naples with 18-hole golf, fitness & spa, resort-style pool, and active club lifestyle.
communityPrivate golf community in Naples featuring two Tom Fazio courses, beach club, and new sports center.
Exclusive private golf club in Naples featuring a Robert von Hagge championship course and sophisticated dining.
 location
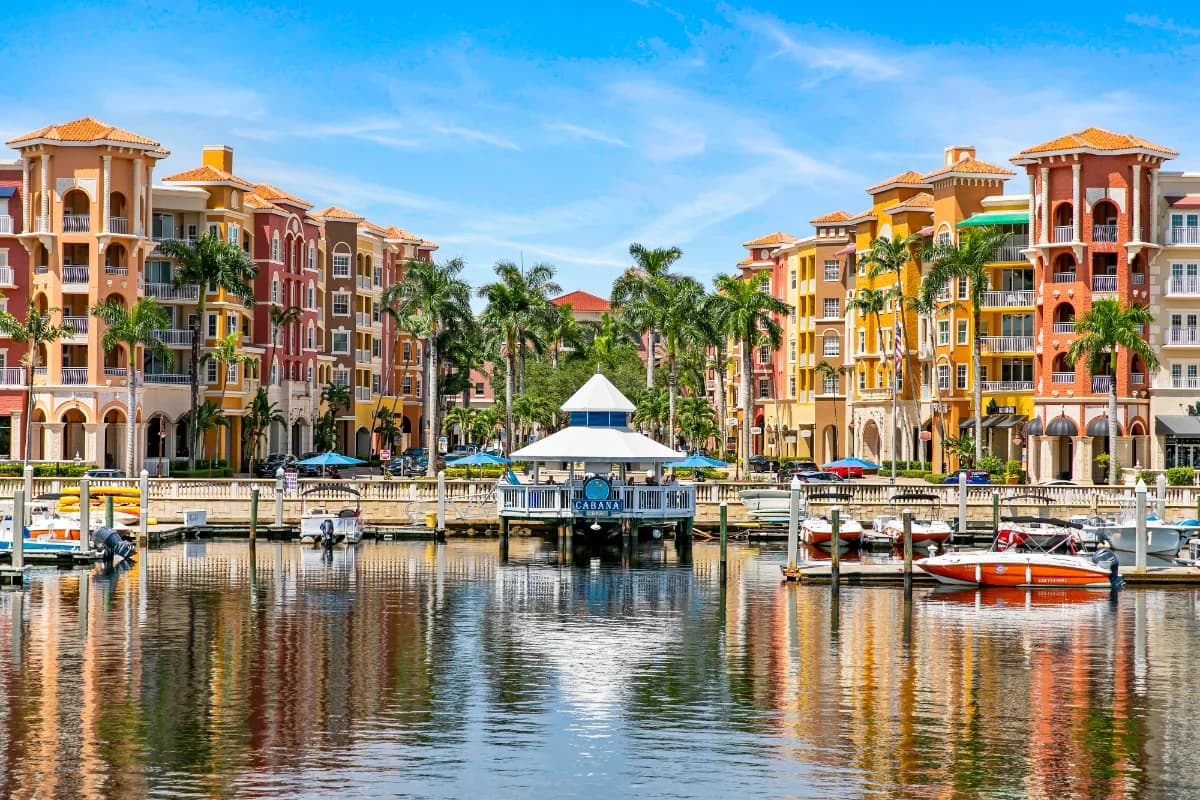
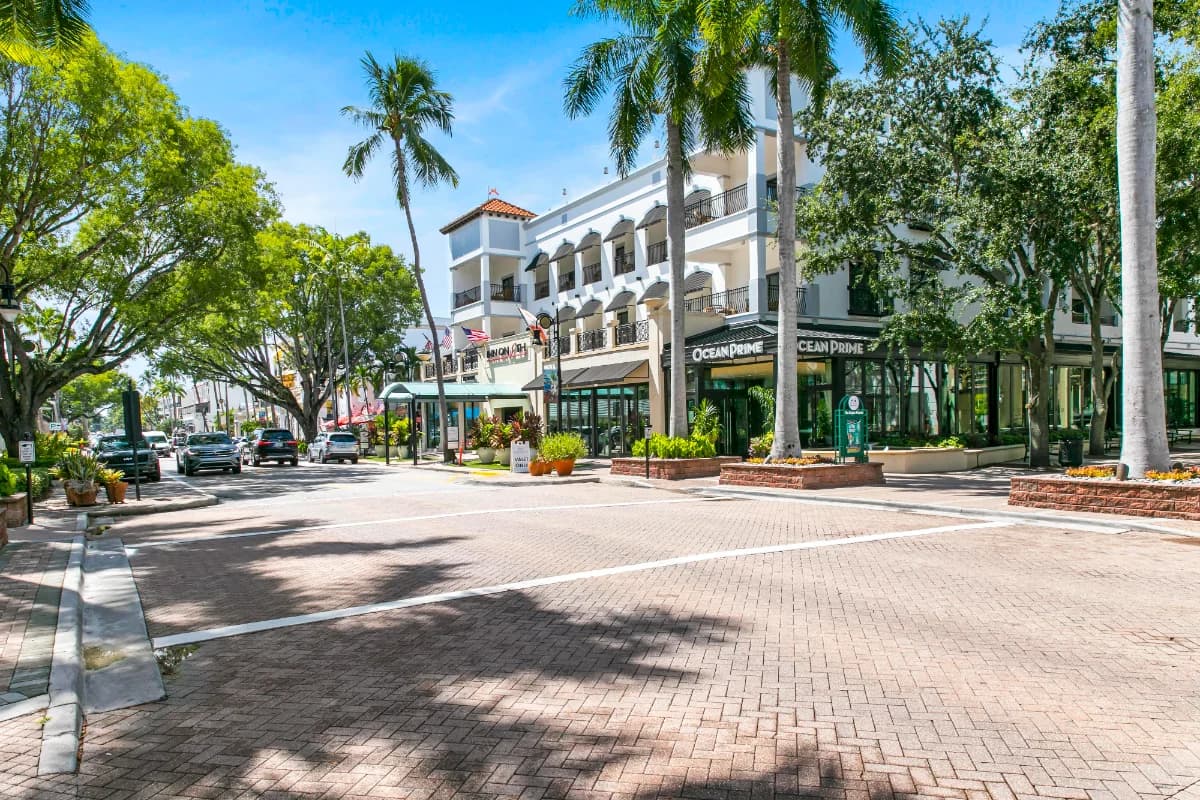
World-class beaches, golf, and coastal lifestyle in Southwest Florida.
 area
area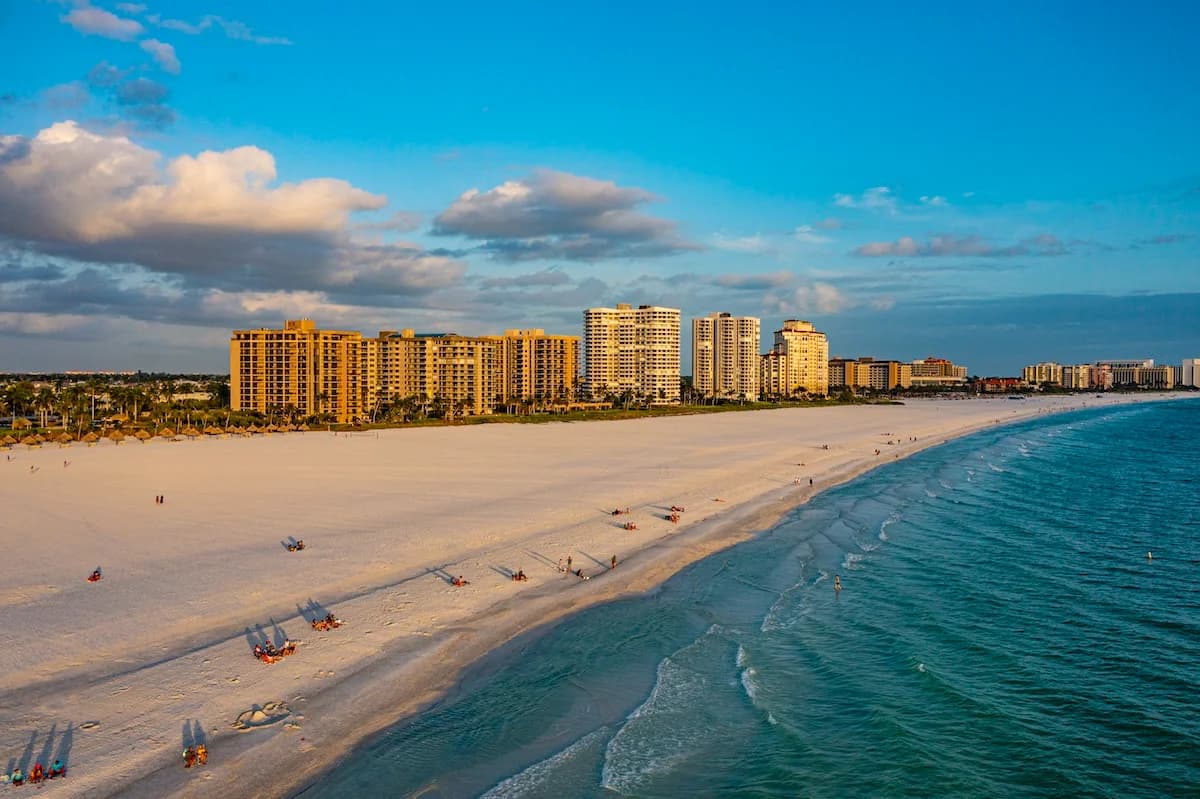 location
Island living with white-sand beaches and boating lifestyle.
locationWorld-class beaches, golf, and coastal lifestyle in Southwest Florida.
arealocationIsland living with white-sand beaches and boating lifestyle.