Riverstone
Gated · $600,000s – $2.3M · Around $500/mo
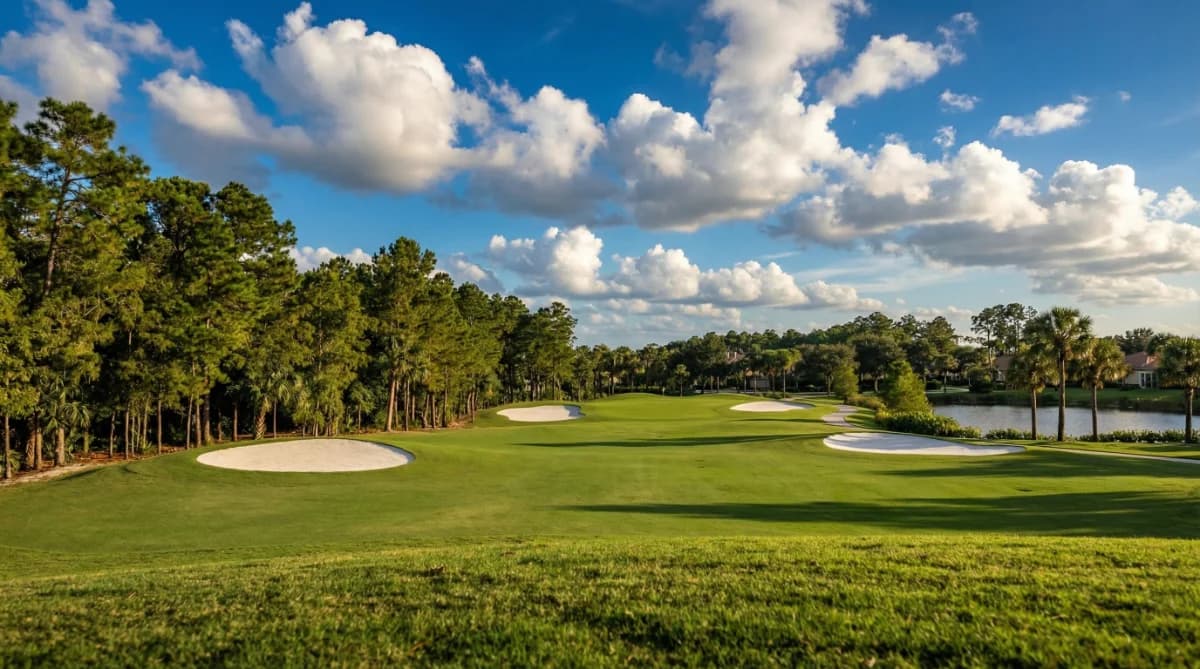
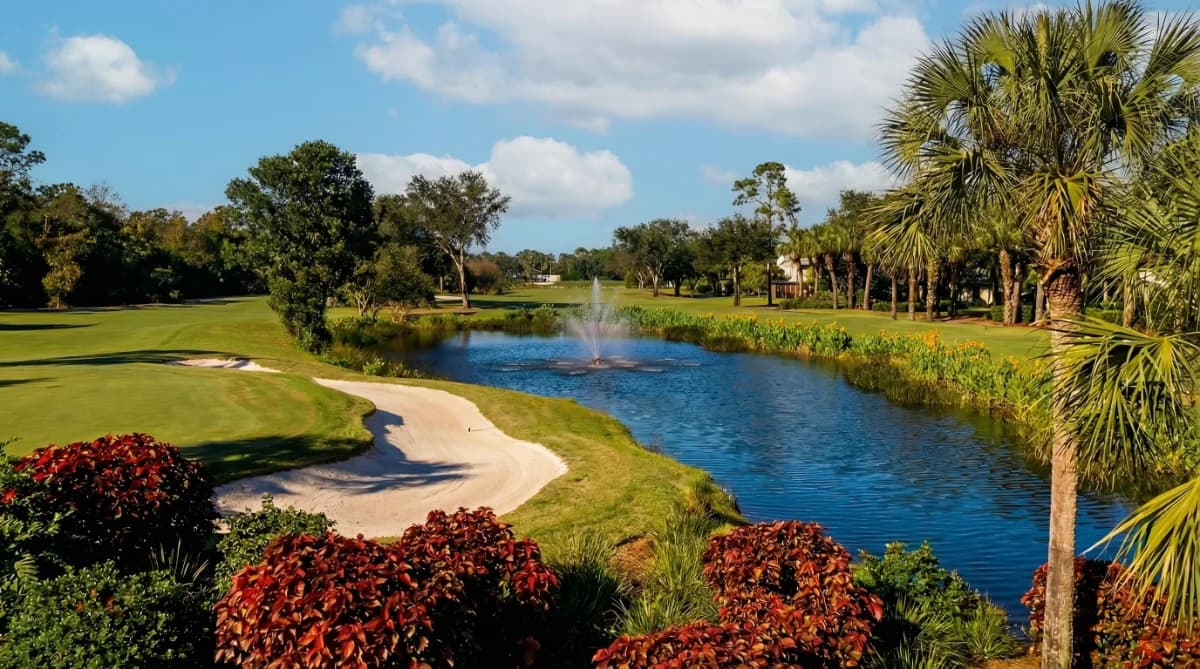
Riverstone is 802 detached single-family houses inside one gate in inland North Naples. Each sits on a platted lot, and nothing here is attached: no coach homes, no villas, no condominiums. GL Homes built all 802, conveying the first in 2012 and the last in mid-2017.
Know this before the title work reaches you: the community was platted twice under two recorded names, and nine of its streets are not legally called Riverstone.
Why does the title work say Saturnia Falls?
Because the first 190 lots were recorded in October 2011 as Saturnia Falls Phase One, before the Riverstone name existed on a plat. The later plats, Riverstone 2 through 7, hold lots 191 through 802.
Nine streets sit in that first plat: Pleasant Springs Drive, Santaren Court, Gibralter Drive, Bering Court, Columbia Court, Glacier Court, Torrens Court, Madeira Court and Seven Seas Drive. A house on any of them is legally described as Saturnia Falls Phase 1, and that is the name you will read on the title commitment and on the survey. The Clerk was still indexing liens under it in 2026. It's the same community either way, only the recorded name of the plat differs, and nothing is wrong with the house.
A third name turns up in the zoning, where the land is Terafina. It's not a second community, and nobody on the ground uses it.
What are the homes like?
Plans run from two bedrooms to six. The smallest floor plans sit at about 1850 square feet and the largest at about 5000. Sold prices start in the $600,000s and reach around $2.3 million, and which of the two plats a house sits in does not move them.
Every purchase is a resale, since the builder finished in 2017 and no phase is still selling from the developer. No lot inside the gate belongs to a builder, a utility or a unit of government either.
What is there to use?
The association describes the facilities in its own words, and the counts and measurements are its own:
- Pools. "A resort-style pool, lap pool, children's wading pool, and whirlpool spa".
- Tennis. "five lighted Har-Tru tennis courts", with "online reservations, weekly round robins, clinics, and private instruction from a professional on-site tennis pro".
- Courts. "Indoor and outdoor basketball and pickleball courts".
- Clubhouse. A "13,000-square-foot clubhouse", set across "six acres of recreational space".
Walk it and count, because indoor court space looks different in person from the way it reads on a page.
Who runs it, and how does the gate work?
The association is managed on site rather than remotely, by Advanced Property Management Services, from an office at 3660 Seven Seas Drive inside the gate, with a property manager and an assistant property manager.
There is a staffed gatehouse at the entrance with its own phone line, and the association says the gated entry is "staffed 24/7". Overnight hours are worth confirming at the gatehouse itself before you offer.
What does it cost to own here?
Budget around $500 a month to the association, and get the recorded declaration and its amendments from the seller before you commit. That one document sets the lease rules, the pet rules, and whether anything beyond the purchase price falls due on the day you close.
Riverstone sits in unincorporated Collier County, so there is no city government and no city tax. County services and county taxes apply, and fire protection is North Collier Fire.
The community is finished. All 802 lots carry a house, nothing new has gone up inside the gate since 2018, and the nine streets keep the Saturnia Falls name on their paperwork.
Quick Facts
- Home Prices
- $600,000s – $2.3M
- Monthly Fees
- Around $500/mo
- Gated
- Yes
- Residences
- 802 detached single-family houses
- Location
- Inland North Naples, unincorporated Collier County
- Home Sizes
- 1,850–5,000 sq ft
- Bedrooms
- 2–6
- Built
- GL Homes, conveyed 2012 to 2017
Properties for Sale
Market Snapshot
The median closed price in Riverstone, North Naples was $1,275,000 in September 2026, up 33% from $957,500 in September 2025, according to NABOR MLS data through September 2026. The median price per square foot was $331 in September 2026, down from $342 in September 2025. In August 2026, the median closed price was $849,500 and the median price per square foot was $341. Total sales activity in Riverstone saw 8 closed sales in September 2026, an increase from 6 sales in September 2025. Pending sales were 4 in September 2026, up from 2 in September 2025. In the prior month, August 2026, there were 2 total sales and 5 pending sales. Inventory showed 12 homes for sale in September 2026, a decrease from 16 homes for sale in September 2025. The months supply of homes for sale was 4 months in September 2026, compared to 4.6 months in September 2025. For August 2026, there were 15 homes for sale and the months supply was 5.3.
October 2026 · Last updated Oct 2, 2026
Pricing
Track how home values are trending in Riverstone. Median sale prices and price-per-square-foot data help buyers and sellers gauge current market positioning.
Median Closed Price
$1,275,000 as of September 2026, up 33.2% year-over-year.
View monthly data
| Month | Median Closed Price |
|---|---|
| October 2025 | $650,000 |
| November 2025 | $720,000 |
| December 2025 | $1,100,000 |
| January 2026 | $890,000 |
| February 2026 | $975,000 |
| March 2026 | $837,500 |
| April 2026 | $965,000 |
| May 2026 | $910,000 |
| June 2026 | $935,000 |
| July 2026 | $1,250,000 |
| August 2026 | $849,500 |
| September 2026 | $1,275,000 |
Source: Naples Area Board of REALTORS® (NABOR®) MLS, via InfoSparks. Data through September 2026. Data deemed reliable but not guaranteed.
Median Prices per Sq ft
$331 as of September 2026, down 3.2% year-over-year.
View monthly data
| Month | Median Prices per Sq ft |
|---|---|
| October 2025 | $327 |
| November 2025 | $346 |
| December 2025 | $407 |
| January 2026 | $275 |
| February 2026 | $424 |
| March 2026 | $355 |
| April 2026 | $342 |
| May 2026 | $340 |
| June 2026 | $370 |
| July 2026 | $367 |
| August 2026 | $341 |
| September 2026 | $331 |
Source: Naples Area Board of REALTORS® (NABOR®) MLS, via InfoSparks. Data through September 2026. Data deemed reliable but not guaranteed.
Median Closed Price
$1,275,000 as of September 2026, up 33.2% year-over-year.
View monthly data
| Month | Median Closed Price |
|---|---|
| October 2025 | $650,000 |
| November 2025 | $720,000 |
| December 2025 | $1,100,000 |
| January 2026 | $890,000 |
| February 2026 | $975,000 |
| March 2026 | $837,500 |
| April 2026 | $965,000 |
| May 2026 | $910,000 |
| June 2026 | $935,000 |
| July 2026 | $1,250,000 |
| August 2026 | $849,500 |
| September 2026 | $1,275,000 |
Source: Naples Area Board of REALTORS® (NABOR®) MLS, via InfoSparks. Data through September 2026. Data deemed reliable but not guaranteed.
$331 as of September 2026, down 3.2% year-over-year.
View monthly data
| Month | Median Prices per Sq ft |
|---|---|
| October 2025 | $327 |
| November 2025 | $346 |
| December 2025 | $407 |
| January 2026 | $275 |
| February 2026 | $424 |
| March 2026 | $355 |
| April 2026 | $342 |
| May 2026 | $340 |
| June 2026 | $370 |
| July 2026 | $367 |
| August 2026 | $341 |
| September 2026 | $331 |
Source: Naples Area Board of REALTORS® (NABOR®) MLS, via InfoSparks. Data through September 2026. Data deemed reliable but not guaranteed.
Inventory
See how many homes are available in Riverstone and how quickly inventory is moving. Months of supply indicates whether conditions favor buyers or sellers.
Homes For Sale
13 as of September 2026, down 18.8% year-over-year.
View monthly data
| Month | Homes For Sale |
|---|---|
| October 2025 | 18 |
| November 2025 | 18 |
| December 2025 | 15 |
| January 2026 | 23 |
| February 2026 | 23 |
| March 2026 | 21 |
| April 2026 | 20 |
| May 2026 | 15 |
| June 2026 | 18 |
| July 2026 | 17 |
| August 2026 | 15 |
| September 2026 | 13 |
Source: Naples Area Board of REALTORS® (NABOR®) MLS, via InfoSparks. Data through September 2026. Data deemed reliable but not guaranteed.
Months Supply
4.3 as of September 2026, down 6.5% year-over-year.
View monthly data
| Month | Months Supply |
|---|---|
| October 2025 | 5 |
| November 2025 | 5 |
| December 2025 | 4.3 |
| January 2026 | 6.6 |
| February 2026 | 6.9 |
| March 2026 | 6.6 |
| April 2026 | 6.2 |
| May 2026 | 5.1 |
| June 2026 | 5.7 |
| July 2026 | 5.7 |
| August 2026 | 5.3 |
| September 2026 | 4.3 |
Source: Naples Area Board of REALTORS® (NABOR®) MLS, via InfoSparks. Data through September 2026. Data deemed reliable but not guaranteed.
Homes For Sale
13 as of September 2026, down 18.8% year-over-year.
View monthly data
| Month | Homes For Sale |
|---|---|
| October 2025 | 18 |
| November 2025 | 18 |
| December 2025 | 15 |
| January 2026 | 23 |
| February 2026 | 23 |
| March 2026 | 21 |
| April 2026 | 20 |
| May 2026 | 15 |
| June 2026 | 18 |
| July 2026 | 17 |
| August 2026 | 15 |
| September 2026 | 13 |
Source: Naples Area Board of REALTORS® (NABOR®) MLS, via InfoSparks. Data through September 2026. Data deemed reliable but not guaranteed.
4.3 as of September 2026, down 6.5% year-over-year.
View monthly data
| Month | Months Supply |
|---|---|
| October 2025 | 5 |
| November 2025 | 5 |
| December 2025 | 4.3 |
| January 2026 | 6.6 |
| February 2026 | 6.9 |
| March 2026 | 6.6 |
| April 2026 | 6.2 |
| May 2026 | 5.1 |
| June 2026 | 5.7 |
| July 2026 | 5.7 |
| August 2026 | 5.3 |
| September 2026 | 4.3 |
Source: Naples Area Board of REALTORS® (NABOR®) MLS, via InfoSparks. Data through September 2026. Data deemed reliable but not guaranteed.
Activity
Monitor real estate transaction volume in Riverstone. Pending and closed sales reflect the pace of buyer demand and overall market momentum.
Pending Sales
3 as of September 2026, up 50.0% year-over-year.
View monthly data
| Month | Pending Sales |
|---|---|
| October 2025 | 2 |
| November 2025 | 1 |
| December 2025 | 3 |
| January 2026 | 1 |
| February 2026 | 6 |
| March 2026 | 1 |
| April 2026 | 5 |
| May 2026 | 4 |
| June 2026 | 1 |
| July 2026 | 6 |
| August 2026 | 5 |
| September 2026 | 3 |
Source: Naples Area Board of REALTORS® (NABOR®) MLS, via InfoSparks. Data through September 2026. Data deemed reliable but not guaranteed.
Total Sales
8 as of September 2026, up 33.3% year-over-year.
View monthly data
| Month | Total Sales |
|---|---|
| October 2025 | 3 |
| November 2025 | 1 |
| December 2025 | 3 |
| January 2026 | 1 |
| February 2026 | 1 |
| March 2026 | 4 |
| April 2026 | 4 |
| May 2026 | 2 |
| June 2026 | 6 |
| July 2026 | 1 |
| August 2026 | 2 |
| September 2026 | 8 |
Source: Naples Area Board of REALTORS® (NABOR®) MLS, via InfoSparks. Data through September 2026. Data deemed reliable but not guaranteed.
Pending Sales
3 as of September 2026, up 50.0% year-over-year.
View monthly data
| Month | Pending Sales |
|---|---|
| October 2025 | 2 |
| November 2025 | 1 |
| December 2025 | 3 |
| January 2026 | 1 |
| February 2026 | 6 |
| March 2026 | 1 |
| April 2026 | 5 |
| May 2026 | 4 |
| June 2026 | 1 |
| July 2026 | 6 |
| August 2026 | 5 |
| September 2026 | 3 |
Source: Naples Area Board of REALTORS® (NABOR®) MLS, via InfoSparks. Data through September 2026. Data deemed reliable but not guaranteed.
8 as of September 2026, up 33.3% year-over-year.
View monthly data
| Month | Total Sales |
|---|---|
| October 2025 | 3 |
| November 2025 | 1 |
| December 2025 | 3 |
| January 2026 | 1 |
| February 2026 | 1 |
| March 2026 | 4 |
| April 2026 | 4 |
| May 2026 | 2 |
| June 2026 | 6 |
| July 2026 | 1 |
| August 2026 | 2 |
| September 2026 | 8 |
Source: Naples Area Board of REALTORS® (NABOR®) MLS, via InfoSparks. Data through September 2026. Data deemed reliable but not guaranteed.