Vanderbilt Beach
Waterfront / boating · $190,000s – $22.5M
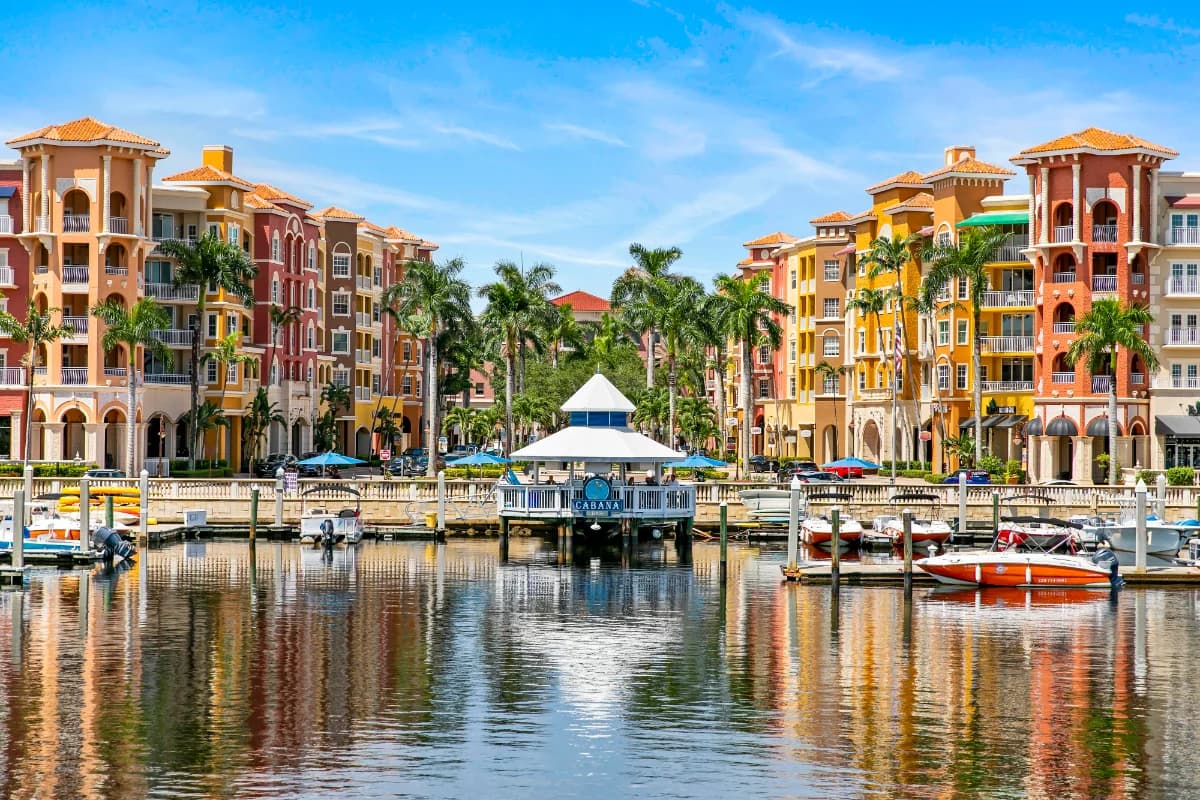
Vanderbilt Beach is a stretch of North Naples coast in unincorporated Collier County, with Gulfshore Drive running along the beach side. Two county beach accesses bracket it, at Vanderbilt Beach Road in the south and Bluebill Avenue in the north. Most of what sells here is condominium, and the oldest homes date to 1958.
One building's documents decide a purchase here. Rules, fees and reserves come from whichever association governs the individual address, and across this strip those fees span more than twice over. Leasing terms are set the same way, building by building. That's the shape of buying on this coast, and the reading that matters is one building's.
What kind of homes are on the strip?
Four products share one name, and the split runs high-rise condominiums 49%, mid-rise 21%, low-rise 4%, detached houses 26%. Floor areas start near 450 square feet and reach about 9000, and bedroom counts go from 1 to 5. What has sold here runs from the $190,000s to around $22.5 million.
A one-bedroom condominium and a Gulf-front penthouse are both sold as Vanderbilt Beach, and they share little as purchases, so there's no average worth quoting.
Age is the money question on a condominium here. Buildings of this vintage come under Florida's structural inspection rules, with reserves that have to be funded against whatever an inspection finds. Two documents then settle your monthly cost: that building's inspection report, and its reserve balance. If the report found work and the account is thin, the difference lands on owners as a special assessment. Three homes in four here are condominium, so read those two first.
How do you reach the beach?
Vanderbilt Beach Park, at 100 Vanderbilt Beach Road, is run by Collier County Parks & Recreation. There's a parking garage plus on-street parking, restrooms, foot showers, bike racks and a concession renting chairs and cabanas. It opens year round, 8 a.m. to sunset, and dogs are not permitted.
The north end works differently. The Bluebill Beach Access, at Bluebill Avenue and Gulfshore Drive, has restrooms, foot showers and bike racks, and the county is blunt about the rest: "No Parking Available: Drop Off Only". Drivers use Conner Park instead, a few blocks east on Bluebill Avenue (111th Street), and dogs are not permitted at Bluebill either.
Delnor-Wiggins Pass State Park is north along Gulfshore Drive, at 11135 Gulfshore Drive. It charges per vehicle, opens 365 days a year, and has a kayak launch and a boat ramp as well as beach. Florida State Parks describes it as occupying "a mile of relatively undisturbed barrier island, one of a few such undeveloped gulf sites in this region preserved for public use". Pets are permitted there, which is not the case at either county access.
Do you have to pay to park at the beach?
Not with a Collier County Resident Beach Parking Permit, which is free to hold. Parking at the county access is free with one, and charged without it. Owning here qualifies you whether or not this is your year-round address, and a driver's license from any state is accepted.
Three documents, all in the owner's name: a driver's license, a vehicle registration or rental agreement, and either a Collier County property tax bill or a warranty deed within three months of closing. Timing matters in season, and the county's own advice is that "parking can be best secured prior to 10 a.m. January through March".
What does Collier County pay for along here?
Collier County levies two Municipal Service Taxing Units over parts of this area, each with its own boundary and list of work. The Vanderbilt Beach Beautification MSTU funds beautification, maintenance and the burial of power lines inside its boundary. The Vanderbilt Waterway MSTU pays for dredging and maintenance of the waterway between the Bluebill Bridge and the Cocohatchee River.
Each has a 5-member committee drawn from inside its boundary, and each is a county line set once a year rather than an association bill. Whether a given address falls inside one, both or neither is an address-by-address question.
Can a boat get out to open water?
Through Wiggins Pass, and the waterway behind these streets is dredged and maintained under a county program rather than out of a building's budget.
The pass itself is unsettled ground, and NOAA's Coast Pilot puts it plainly: "Wiggins Pass, 4 miles north of Clam Pass, is subject to frequent changes. The pass is used by small craft entering Cocohatchee River and the chain of lagoons and inland waterways that lead north to the passes in Estero Bay."
Two measurements decide whether a particular boat works from a particular address: the vertical clearance at the Bluebill Avenue bridge, and the depth that boat can carry through the pass. Neither has a strip-wide answer.
What has to be settled before an offer?
- What that home is billed each month, in writing.
- Whether the reserve covers what the inspection report found.
- Whether the address sits inside either county unit, and what it adds a year.
- Bridge clearance and pass depth, against the boat you own.
Pelican Bay, Naples Park, The Dunes of Naples, Vanderbilt Shores and The Vanderbilt are each their own community with their own documents, and a search on any of those names finds that one. Vanderbilt Beach is the coast itself, from the Vanderbilt Beach Road access up to Bluebill Avenue.
Quick Facts
- Home Prices
- $190,000s – $22.5M
- Community Type
- Waterfront / boating
- Residences
- Mostly condominiums; about a quarter detached houses
- Location
- North Naples coast, unincorporated Collier County
- Home Sizes
- 450–9,000 sq ft
- Bedrooms
- 1–5
- Built
- 1958 onward
Amenities
Properties for Sale
Market Snapshot
The median closed price in Vanderbilt Beach, North Naples, was $1,600,000 in September 2026, down 34.7% from $2,450,000 a year earlier, according to NABOR MLS data through September 2026. The median price per square foot was $840 in September 2026, which is a decrease from $1,203 in September 2025. In August 2026, the median closed price was $825,000, and the median price per square foot was $553. Inventory in Vanderbilt Beach saw a significant decrease, with 62 homes for sale in September 2026, down from 100 homes for sale in September 2025. This represents a continued downward trend from 146 homes for sale in February 2026. Months supply of homes for sale stood at 6.6 months in September 2026, a notable decrease from 15 months in September 2025, indicating a tightening market. Sales activity remained relatively stable. There were 8 pending sales in September 2026, which is consistent with the 7 pending sales in September 2025. Total sales for September 2026 were 10, an increase from 7 total sales in September 2025. In May 2026, there were 22 total sales, marking the highest sales volume in the past year.
October 2026 · Last updated Oct 2, 2026
Pricing
Track how home values are trending in Vanderbilt Beach. Median sale prices and price-per-square-foot data help buyers and sellers gauge current market positioning.
Median Closed Price
$1,600,000 as of September 2026, down 34.7% year-over-year.
View monthly data
| Month | Median Closed Price |
|---|---|
| October 2025 | $955,000 |
| November 2025 | $975,000 |
| December 2025 | $1,550,000 |
| January 2026 | $1,772,500 |
| February 2026 | $1,080,000 |
| March 2026 | $1,480,000 |
| April 2026 | $1,025,000 |
| May 2026 | $1,010,000 |
| June 2026 | $900,000 |
| July 2026 | $1,055,000 |
| August 2026 | $825,000 |
| September 2026 | $1,600,000 |
Source: Naples Area Board of REALTORS® (NABOR®) MLS, via InfoSparks. Data through September 2026. Data deemed reliable but not guaranteed.
Median Prices per Sq ft
$840 as of September 2026, down 30.2% year-over-year.
View monthly data
| Month | Median Prices per Sq ft |
|---|---|
| October 2025 | $700 |
| November 2025 | $781 |
| December 2025 | $832 |
| January 2026 | $812 |
| February 2026 | $617 |
| March 2026 | $905 |
| April 2026 | $695 |
| May 2026 | $660 |
| June 2026 | $525 |
| July 2026 | $712 |
| August 2026 | $553 |
| September 2026 | $840 |
Source: Naples Area Board of REALTORS® (NABOR®) MLS, via InfoSparks. Data through September 2026. Data deemed reliable but not guaranteed.
Median Closed Price
$1,600,000 as of September 2026, down 34.7% year-over-year.
View monthly data
| Month | Median Closed Price |
|---|---|
| October 2025 | $955,000 |
| November 2025 | $975,000 |
| December 2025 | $1,550,000 |
| January 2026 | $1,772,500 |
| February 2026 | $1,080,000 |
| March 2026 | $1,480,000 |
| April 2026 | $1,025,000 |
| May 2026 | $1,010,000 |
| June 2026 | $900,000 |
| July 2026 | $1,055,000 |
| August 2026 | $825,000 |
| September 2026 | $1,600,000 |
Source: Naples Area Board of REALTORS® (NABOR®) MLS, via InfoSparks. Data through September 2026. Data deemed reliable but not guaranteed.
$840 as of September 2026, down 30.2% year-over-year.
View monthly data
| Month | Median Prices per Sq ft |
|---|---|
| October 2025 | $700 |
| November 2025 | $781 |
| December 2025 | $832 |
| January 2026 | $812 |
| February 2026 | $617 |
| March 2026 | $905 |
| April 2026 | $695 |
| May 2026 | $660 |
| June 2026 | $525 |
| July 2026 | $712 |
| August 2026 | $553 |
| September 2026 | $840 |
Source: Naples Area Board of REALTORS® (NABOR®) MLS, via InfoSparks. Data through September 2026. Data deemed reliable but not guaranteed.
Inventory
See how many homes are available in Vanderbilt Beach and how quickly inventory is moving. Months of supply indicates whether conditions favor buyers or sellers.
Homes For Sale
64 as of September 2026, down 36.0% year-over-year.
View monthly data
| Month | Homes For Sale |
|---|---|
| October 2025 | 112 |
| November 2025 | 120 |
| December 2025 | 129 |
| January 2026 | 145 |
| February 2026 | 151 |
| March 2026 | 141 |
| April 2026 | 118 |
| May 2026 | 111 |
| June 2026 | 95 |
| July 2026 | 77 |
| August 2026 | 72 |
| September 2026 | 64 |
Source: Naples Area Board of REALTORS® (NABOR®) MLS, via InfoSparks. Data through September 2026. Data deemed reliable but not guaranteed.
Months Supply
6.8 as of September 2026, down 54.7% year-over-year.
View monthly data
| Month | Months Supply |
|---|---|
| October 2025 | 16.2 |
| November 2025 | 16.7 |
| December 2025 | 17 |
| January 2026 | 18.3 |
| February 2026 | 19.6 |
| March 2026 | 18 |
| April 2026 | 15.4 |
| May 2026 | 13.1 |
| June 2026 | 10.4 |
| July 2026 | 8.2 |
| August 2026 | 7.9 |
| September 2026 | 6.8 |
Source: Naples Area Board of REALTORS® (NABOR®) MLS, via InfoSparks. Data through September 2026. Data deemed reliable but not guaranteed.
Homes For Sale
64 as of September 2026, down 36.0% year-over-year.
View monthly data
| Month | Homes For Sale |
|---|---|
| October 2025 | 112 |
| November 2025 | 120 |
| December 2025 | 129 |
| January 2026 | 145 |
| February 2026 | 151 |
| March 2026 | 141 |
| April 2026 | 118 |
| May 2026 | 111 |
| June 2026 | 95 |
| July 2026 | 77 |
| August 2026 | 72 |
| September 2026 | 64 |
Source: Naples Area Board of REALTORS® (NABOR®) MLS, via InfoSparks. Data through September 2026. Data deemed reliable but not guaranteed.
6.8 as of September 2026, down 54.7% year-over-year.
View monthly data
| Month | Months Supply |
|---|---|
| October 2025 | 16.2 |
| November 2025 | 16.7 |
| December 2025 | 17 |
| January 2026 | 18.3 |
| February 2026 | 19.6 |
| March 2026 | 18 |
| April 2026 | 15.4 |
| May 2026 | 13.1 |
| June 2026 | 10.4 |
| July 2026 | 8.2 |
| August 2026 | 7.9 |
| September 2026 | 6.8 |
Source: Naples Area Board of REALTORS® (NABOR®) MLS, via InfoSparks. Data through September 2026. Data deemed reliable but not guaranteed.
Activity
Monitor real estate transaction volume in Vanderbilt Beach. Pending and closed sales reflect the pace of buyer demand and overall market momentum.
Pending Sales
9 as of September 2026, up 28.6% year-over-year.
View monthly data
| Month | Pending Sales |
|---|---|
| October 2025 | 8 |
| November 2025 | 6 |
| December 2025 | 4 |
| January 2026 | 9 |
| February 2026 | 12 |
| March 2026 | 16 |
| April 2026 | 23 |
| May 2026 | 6 |
| June 2026 | 7 |
| July 2026 | 8 |
| August 2026 | 7 |
| September 2026 | 9 |
Source: Naples Area Board of REALTORS® (NABOR®) MLS, via InfoSparks. Data through September 2026. Data deemed reliable but not guaranteed.
Total Sales
10 as of September 2026, up 42.9% year-over-year.
View monthly data
| Month | Total Sales |
|---|---|
| October 2025 | 9 |
| November 2025 | 5 |
| December 2025 | 7 |
| January 2026 | 6 |
| February 2026 | 8 |
| March 2026 | 12 |
| April 2026 | 13 |
| May 2026 | 22 |
| June 2026 | 9 |
| July 2026 | 7 |
| August 2026 | 5 |
| September 2026 | 10 |
Source: Naples Area Board of REALTORS® (NABOR®) MLS, via InfoSparks. Data through September 2026. Data deemed reliable but not guaranteed.
Pending Sales
9 as of September 2026, up 28.6% year-over-year.
View monthly data
| Month | Pending Sales |
|---|---|
| October 2025 | 8 |
| November 2025 | 6 |
| December 2025 | 4 |
| January 2026 | 9 |
| February 2026 | 12 |
| March 2026 | 16 |
| April 2026 | 23 |
| May 2026 | 6 |
| June 2026 | 7 |
| July 2026 | 8 |
| August 2026 | 7 |
| September 2026 | 9 |
Source: Naples Area Board of REALTORS® (NABOR®) MLS, via InfoSparks. Data through September 2026. Data deemed reliable but not guaranteed.
10 as of September 2026, up 42.9% year-over-year.
View monthly data
| Month | Total Sales |
|---|---|
| October 2025 | 9 |
| November 2025 | 5 |
| December 2025 | 7 |
| January 2026 | 6 |
| February 2026 | 8 |
| March 2026 | 12 |
| April 2026 | 13 |
| May 2026 | 22 |
| June 2026 | 9 |
| July 2026 | 7 |
| August 2026 | 5 |
| September 2026 | 10 |
Source: Naples Area Board of REALTORS® (NABOR®) MLS, via InfoSparks. Data through September 2026. Data deemed reliable but not guaranteed.