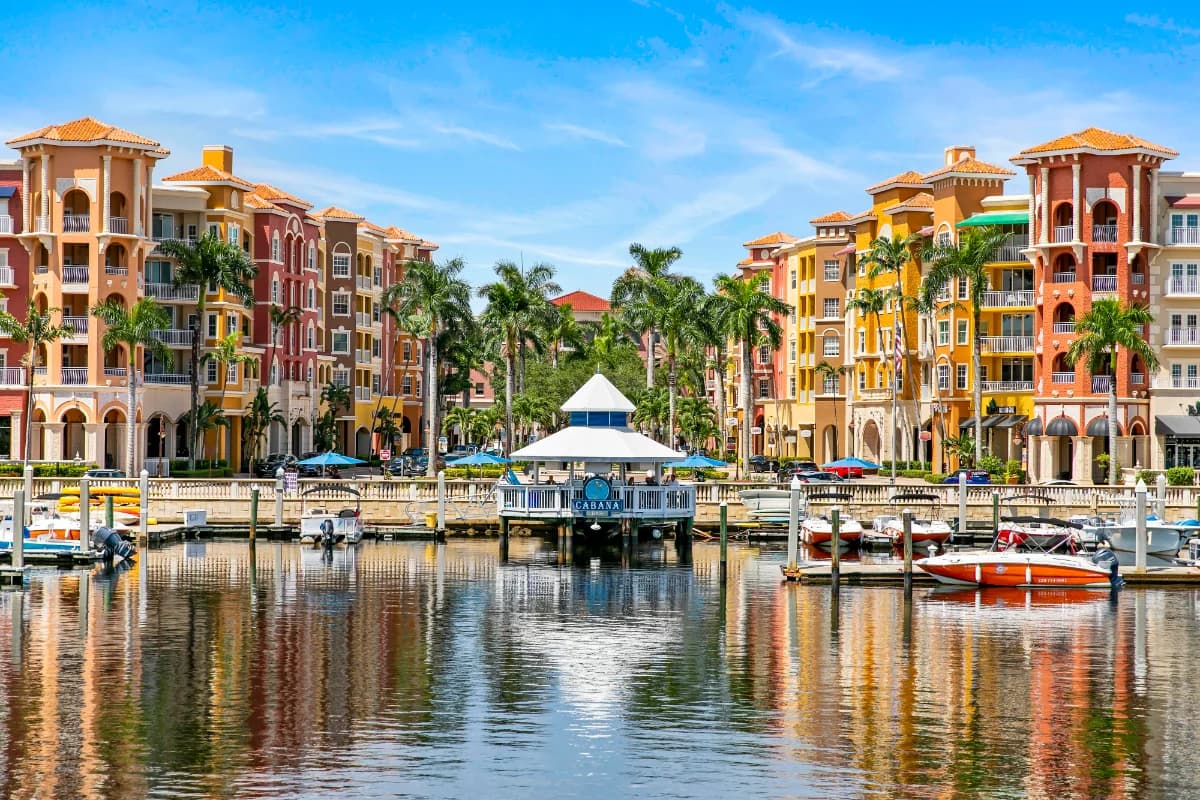
Brittany
Tower homes sold $2.4M – $5M
The Brittany is a single beachfront condominium at 4021 Gulf Shore Boulevard North, in Park Shore. One building of three connecting towers, with six villas standing in front of it, and 127 homes in all on about six acres. Gulf Bay Development built it. The building dates from 1995, and the last of the villas from 1996.
Start with the land. It runs about 830 feet west from Gulf Shore Boulevard to the Gulf, and nothing stands between the building and the water. A beach entrance on the property leads out to the sand, and there are showers at it. The Park Shore Association's beach park, up the road, is a different place on different terms. Merging the two is the easiest mistake to make here.
What are the homes like?
Four repeating sizes in the tower, then a set of larger one-offs. The tower carries six homes on every floor, across floors 2 through 21, and there's no 13th floor. That makes 19 residential floors and 114 homes. Those tower homes run about 2,500, 3,050, 3,200 and 3,400 square feet. The four garden homes go from about 1,740 to about 3,100 square feet, and the six villas from about 3,380 to about 4,000. The three penthouses are just under 6,000 each.
The villas stand in front of the tower, with their own elevators and private outdoor garden spaces. They are condominium homes under the same declaration rather than freestanding houses, so you are buying into the same association either way.
Is the beach park part of the building?
No. The Park Shore Association sits outside the condominium entirely, and the beachfront park it owns is about a quarter of a mile north of here, at its own address. Only members are admitted, and nothing about that park comes with a home at The Brittany.
Joining is voluntary. The terms sit with the association: an annual membership, plus a one-time initiation for a new member. Eligibility sits there too, so ask the association whether an owner at this address can join and on what basis. The Village Shops on Venetian Bay, which everybody calls Venetian Village, sit a quarter of a mile north too.
What's on the property?
A lap lane pool sits on the beachfront deck with a jacuzzi beside it. The fitness room is open around the clock, with treadmills, ellipticals, bikes and free weights. There are two Har-Tru tennis courts with a shade station, a bocce court, and a massage room that can be reserved with a therapist. Indoors there are four guest suites, a card room with game tables, a library and a conference room. Outside, a covered grill pavilion holds two grills, and there's a fire pit and cabanas at the pool deck. Upper plaza decks look out on the Gulf side and on the bay side. Showers are at the pool deck as well as at the beach entrance.
There is staff on site: "a General Manager, Office Administrator, 24-hour Front Desk Security, Maintenance and Housekeeping crews."
What do homes here cost?
Tower homes have sold from around $2.4 million to around $5 million. The garden homes, the villas and the penthouses are all larger, and that range doesn't describe them.
What should you know about the building's age?
A concrete tower built in 1995 has to be examined by an engineer for structural condition on a repeating cycle. It also has to hold an engineering study setting out what it must put aside for the roof, the structure, the waterproofing, the windows and the other major components. For budgets adopted from the end of 2024 onward, the owners lost the right to underfund those reserves. They cannot divert the money to something else either.
So the assessment a buyer inherits is tied to the engineer's findings and to the sum the study says has to be set aside. Neither document is published where a buyer could look it up. Ask the association for both, and read them before you name a price.
What should you pin down before making an offer?
Five things worth having in hand:
- The most recent structural inspection report, plus the reserve study that goes with it.
- What the assessment is on the specific home, and what it pays for.
- The pet rules.
- Leasing: the shortest term the documents allow, and the number of tenancies permitted each year.
- Whether a poolside cabana is included with a given home.
Parking here is deeded rather than assigned, so the spaces are part of what changes hands. The building states it plainly: "Two parking spaces are deeded to each unit in the towers except for the Penthouses which have three." That covers the tower and the penthouses, and the six villas have their garages instead.
Quick Facts
- Home Prices
- Tower homes sold $2.4M – $5M
- Residences
- 127 condominium homes, including six villas
- Location
- 4021 Gulf Shore Blvd N, Park Shore
- Established
- 1995 (last villas 1996)
- Home Sizes
- 1,700–6,000 sq ft
Properties for Sale
Market Snapshot
There were 5 condos for sale in Brittany, Park Shore, Naples, in September 2026, compared to 7 in September 2025, according to NABOR MLS data through September 2026. This represents a decrease in available inventory. There were no closed sales recorded for condos in September 2026, nor in September 2025. The median closed price for condos in Brittany was $4,000,000 in June 2026, based on 1 closed sale. For comparison, the median closed price was $3,050,000 in June 2025, based on 2 closed sales. The median price per square foot for condos was $1,311 in June 2026. Months supply of inventory for condos in Brittany was 2.7 months in September 2026, remaining consistent with the 5.0 months supply in September 2025. There were no pending sales in September 2026, similar to September 2025, which saw 1 pending sale for condos.
October 2026 · Last updated Oct 2, 2026
Pricing
Track how home values are trending in Brittany. Median sale prices and price-per-square-foot data help buyers and sellers gauge current market positioning.
Median Closed Price
$4,000,000 as of June 2026, up 31.1% year-over-year.
View monthly data
| Month | Median Closed Price |
|---|---|
| February 2025 | $4,025,000 |
| March 2025 | $4,700,000 |
| April 2025 | $3,800,000 |
| June 2025 | $3,050,000 |
| July 2025 | $2,500,000 |
| November 2025 | $2,750,000 |
| December 2025 | $2,700,000 |
| February 2026 | $2,800,000 |
| March 2026 | $2,700,000 |
| April 2026 | $2,562,500 |
| May 2026 | $3,812,500 |
| June 2026 | $4,000,000 |
Source: Naples Area Board of REALTORS® (NABOR®) MLS, via InfoSparks. Data through June 2026. Data deemed reliable but not guaranteed.
Median Prices per Sq ft
$1,311 as of June 2026, up 47.6% year-over-year.
View monthly data
| Month | Median Prices per Sq ft |
|---|---|
| February 2025 | $1,378 |
| March 2025 | $1,434 |
| April 2025 | $1,520 |
| June 2025 | $888 |
| July 2025 | $820 |
| November 2025 | $902 |
| December 2025 | $825 |
| February 2026 | $918 |
| March 2026 | $796 |
| April 2026 | $967 |
| May 2026 | $1,147 |
| June 2026 | $1,311 |
Source: Naples Area Board of REALTORS® (NABOR®) MLS, via InfoSparks. Data through June 2026. Data deemed reliable but not guaranteed.
Median Closed Price
$4,000,000 as of June 2026, up 31.1% year-over-year.
View monthly data
| Month | Median Closed Price |
|---|---|
| February 2025 | $4,025,000 |
| March 2025 | $4,700,000 |
| April 2025 | $3,800,000 |
| June 2025 | $3,050,000 |
| July 2025 | $2,500,000 |
| November 2025 | $2,750,000 |
| December 2025 | $2,700,000 |
| February 2026 | $2,800,000 |
| March 2026 | $2,700,000 |
| April 2026 | $2,562,500 |
| May 2026 | $3,812,500 |
| June 2026 | $4,000,000 |
Source: Naples Area Board of REALTORS® (NABOR®) MLS, via InfoSparks. Data through June 2026. Data deemed reliable but not guaranteed.
$1,311 as of June 2026, up 47.6% year-over-year.
View monthly data
| Month | Median Prices per Sq ft |
|---|---|
| February 2025 | $1,378 |
| March 2025 | $1,434 |
| April 2025 | $1,520 |
| June 2025 | $888 |
| July 2025 | $820 |
| November 2025 | $902 |
| December 2025 | $825 |
| February 2026 | $918 |
| March 2026 | $796 |
| April 2026 | $967 |
| May 2026 | $1,147 |
| June 2026 | $1,311 |
Source: Naples Area Board of REALTORS® (NABOR®) MLS, via InfoSparks. Data through June 2026. Data deemed reliable but not guaranteed.
Inventory
See how many homes are available in Brittany and how quickly inventory is moving. Months of supply indicates whether conditions favor buyers or sellers.
Homes For Sale
5 as of September 2026, down 28.6% year-over-year.
View monthly data
| Month | Homes For Sale |
|---|---|
| October 2025 | 10 |
| November 2025 | 12 |
| December 2025 | 9 |
| January 2026 | 9 |
| February 2026 | 8 |
| March 2026 | 5 |
| April 2026 | 8 |
| May 2026 | 5 |
| June 2026 | 5 |
| July 2026 | 5 |
| August 2026 | 4 |
| September 2026 | 5 |
Source: Naples Area Board of REALTORS® (NABOR®) MLS, via InfoSparks. Data through September 2026. Data deemed reliable but not guaranteed.
Months Supply
2.7 as of September 2026, down 46.0% year-over-year.
View monthly data
| Month | Months Supply |
|---|---|
| October 2025 | 7.1 |
| November 2025 | 9 |
| December 2025 | 5.7 |
| January 2026 | 5.7 |
| February 2026 | 5.6 |
| March 2026 | 2.9 |
| April 2026 | 4.3 |
| May 2026 | 2.7 |
| June 2026 | 2.9 |
| July 2026 | 2.7 |
| August 2026 | 2.2 |
| September 2026 | 2.7 |
Source: Naples Area Board of REALTORS® (NABOR®) MLS, via InfoSparks. Data through September 2026. Data deemed reliable but not guaranteed.
Homes For Sale
5 as of September 2026, down 28.6% year-over-year.
View monthly data
| Month | Homes For Sale |
|---|---|
| October 2025 | 10 |
| November 2025 | 12 |
| December 2025 | 9 |
| January 2026 | 9 |
| February 2026 | 8 |
| March 2026 | 5 |
| April 2026 | 8 |
| May 2026 | 5 |
| June 2026 | 5 |
| July 2026 | 5 |
| August 2026 | 4 |
| September 2026 | 5 |
Source: Naples Area Board of REALTORS® (NABOR®) MLS, via InfoSparks. Data through September 2026. Data deemed reliable but not guaranteed.
2.7 as of September 2026, down 46.0% year-over-year.
View monthly data
| Month | Months Supply |
|---|---|
| October 2025 | 7.1 |
| November 2025 | 9 |
| December 2025 | 5.7 |
| January 2026 | 5.7 |
| February 2026 | 5.6 |
| March 2026 | 2.9 |
| April 2026 | 4.3 |
| May 2026 | 2.7 |
| June 2026 | 2.9 |
| July 2026 | 2.7 |
| August 2026 | 2.2 |
| September 2026 | 2.7 |
Source: Naples Area Board of REALTORS® (NABOR®) MLS, via InfoSparks. Data through September 2026. Data deemed reliable but not guaranteed.
Activity
Monitor real estate transaction volume in Brittany. Pending and closed sales reflect the pace of buyer demand and overall market momentum.
Pending Sales
0 as of September 2026, down 100.0% year-over-year.
View monthly data
| Month | Pending Sales |
|---|---|
| October 2025 | 0 |
| November 2025 | 0 |
| December 2025 | 4 |
| January 2026 | 2 |
| February 2026 | 1 |
| March 2026 | 2 |
| April 2026 | 0 |
| May 2026 | 3 |
| June 2026 | 0 |
| July 2026 | 0 |
| August 2026 | 0 |
| September 2026 | 0 |
Source: Naples Area Board of REALTORS® (NABOR®) MLS, via InfoSparks. Data through September 2026. Data deemed reliable but not guaranteed.
Total Sales
0 as of September 2026.
View monthly data
| Month | Total Sales |
|---|---|
| October 2025 | 0 |
| November 2025 | 1 |
| December 2025 | 3 |
| January 2026 | 0 |
| February 2026 | 1 |
| March 2026 | 3 |
| April 2026 | 2 |
| May 2026 | 2 |
| June 2026 | 1 |
| July 2026 | 0 |
| August 2026 | 0 |
| September 2026 | 0 |
Source: Naples Area Board of REALTORS® (NABOR®) MLS, via InfoSparks. Data through September 2026. Data deemed reliable but not guaranteed.
Pending Sales
0 as of September 2026, down 100.0% year-over-year.
View monthly data
| Month | Pending Sales |
|---|---|
| October 2025 | 0 |
| November 2025 | 0 |
| December 2025 | 4 |
| January 2026 | 2 |
| February 2026 | 1 |
| March 2026 | 2 |
| April 2026 | 0 |
| May 2026 | 3 |
| June 2026 | 0 |
| July 2026 | 0 |
| August 2026 | 0 |
| September 2026 | 0 |
Source: Naples Area Board of REALTORS® (NABOR®) MLS, via InfoSparks. Data through September 2026. Data deemed reliable but not guaranteed.
0 as of September 2026.
View monthly data
| Month | Total Sales |
|---|---|
| October 2025 | 0 |
| November 2025 | 1 |
| December 2025 | 3 |
| January 2026 | 0 |
| February 2026 | 1 |
| March 2026 | 3 |
| April 2026 | 2 |
| May 2026 | 2 |
| June 2026 | 1 |
| July 2026 | 0 |
| August 2026 | 0 |
| September 2026 | 0 |
Source: Naples Area Board of REALTORS® (NABOR®) MLS, via InfoSparks. Data through September 2026. Data deemed reliable but not guaranteed.