Lbuilding
Naples • Park Shore
Le Jardin
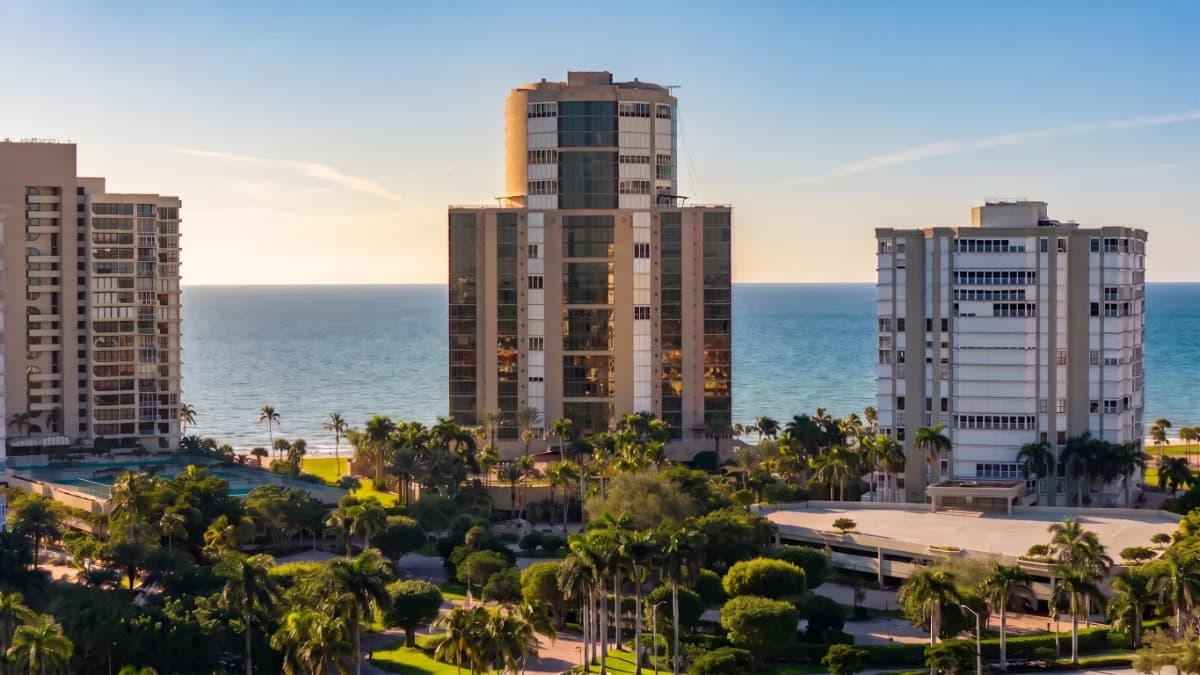
Luxury beachfront condominium in Park Shore with spacious residences and Gulf views.
Gated
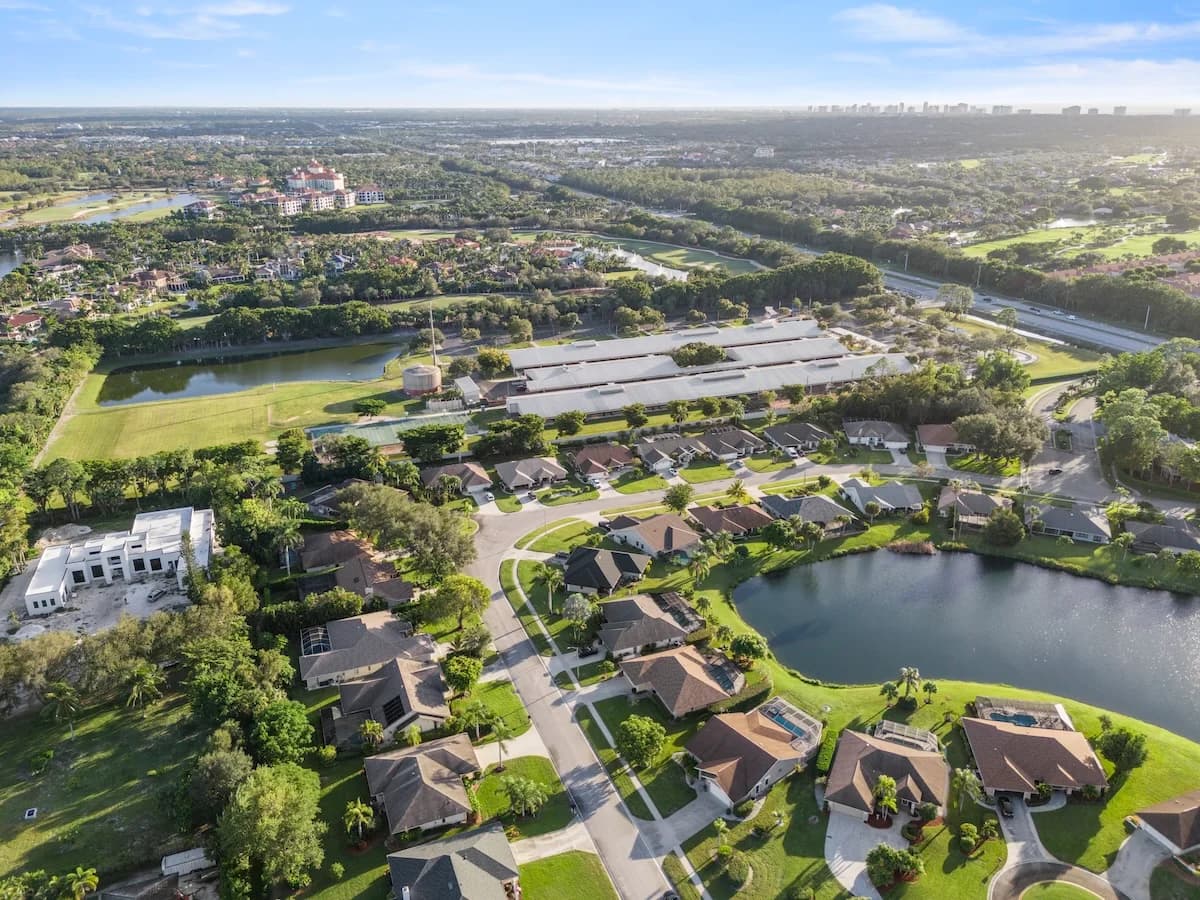
Park Shore is one of Naples’ most established beachfront communities, known for its balance of waterfront living and everyday convenience. Developed through the 1960s and 1970s, the neighborhood offers a mix of beachfront high-rises, bayfront condominiums, and single-family homes, all thoughtfully positioned between the Gulf and Venetian Bay.
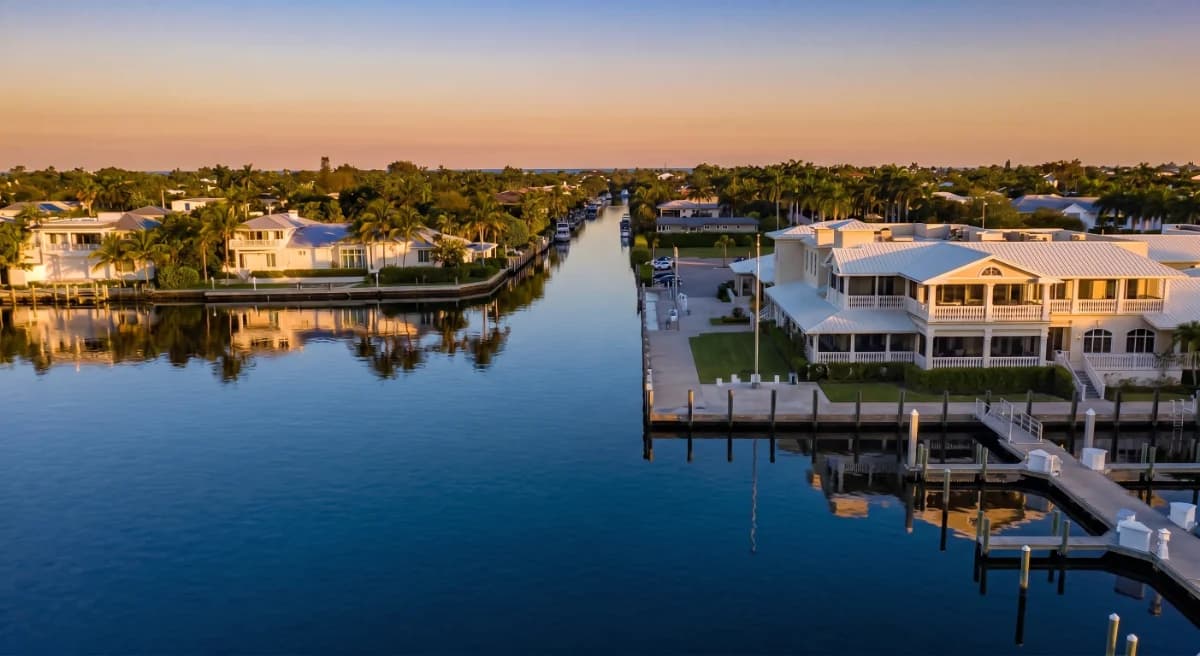
Residents enjoy private beach access through the Park Shore Beach Park, along with the ability to lease or own boat slips along Venetian Bay. The community is also home to Venetian Village, a waterfront collection of boutiques and dining destinations that adds a walkable, lifestyle-oriented element to the area.
Ideally located just north of downtown Naples, Park Shore offers close proximity to Fifth Avenue South and Third Street South while maintaining a quieter, residential feel. The combination of water access, walkability, and established surroundings continues to make it one of Naples’ most consistently sought-after communities.
The Park Shore real estate market in Naples shows a median price per square foot of $890 as of April 2026. This represents a recent increase from February 2026, when it was $765. Looking back to April 2025, the median price per square foot was significantly higher at $1176, indicating a year-over-year decrease, although the trend has been upward in the short term. Inventory levels in Park Shore continue to be elevated. As of April 2026, there were 200 homes for sale. This is down slightly from 226 in March 2026 but lower than the high of 286 in March of 2025. The months supply of homes for sale was 10.5 in April 2026, which is down from 13.7 in February 2026. Sales activity in Park Shore has seen an uptick, with 35 total sales recorded in April 2026. This is up from 18 in February 2026. Pending sales also reflect this increase, rising to 34 in April 2026, a notable jump from 22 in January 2026 and only 15 in April of the previous year. These figures suggest increasing buyer interest in the Park Shore market.
May 2026 · Last updated May 2, 2026
Track how home values are trending in Park Shore. Median sale prices and price-per-square-foot data help buyers and sellers gauge current market positioning.
Median Closed Price
$727 as of June 2026, up 13.1% year-over-year.
| Month | Median Closed Price |
|---|---|
| July 2025 | $821 |
| August 2025 | $555 |
| September 2025 | $967 |
| October 2025 | $775 |
| November 2025 | $892 |
| December 2025 | $849 |
| January 2026 | $823 |
| February 2026 | $765 |
| March 2026 | $829 |
| April 2026 | $890 |
| May 2026 | $876 |
| June 2026 | $727 |
Source: Naples Area Board of REALTORS® (NABOR®) MLS, via InfoSparks. Data through June 2026. Data deemed reliable but not guaranteed.
Median Prices per Sq ft
$727 as of June 2026, up 13.1% year-over-year.
| Month | Median Prices per Sq ft |
|---|---|
| July 2025 | $821 |
| August 2025 | $555 |
| September 2025 | $967 |
| October 2025 | $775 |
| November 2025 | $892 |
| December 2025 | $849 |
| January 2026 | $823 |
| February 2026 | $765 |
| March 2026 | $829 |
| April 2026 | $890 |
| May 2026 | $876 |
| June 2026 | $727 |
Source: Naples Area Board of REALTORS® (NABOR®) MLS, via InfoSparks. Data through June 2026. Data deemed reliable but not guaranteed.
Median Closed Price
$727 as of June 2026, up 13.1% year-over-year.
| Month | Median Closed Price |
|---|---|
| July 2025 | $821 |
| August 2025 | $555 |
| September 2025 | $967 |
| October 2025 | $775 |
| November 2025 | $892 |
| December 2025 | $849 |
| January 2026 | $823 |
| February 2026 | $765 |
| March 2026 | $829 |
| April 2026 | $890 |
| May 2026 | $876 |
| June 2026 | $727 |
Source: Naples Area Board of REALTORS® (NABOR®) MLS, via InfoSparks. Data through June 2026. Data deemed reliable but not guaranteed.
$727 as of June 2026, up 13.1% year-over-year.
| Month | Median Prices per Sq ft |
|---|---|
| July 2025 | $821 |
| August 2025 | $555 |
| September 2025 | $967 |
| October 2025 | $775 |
| November 2025 | $892 |
| December 2025 | $849 |
| January 2026 | $823 |
| February 2026 | $765 |
| March 2026 | $829 |
| April 2026 | $890 |
| May 2026 | $876 |
| June 2026 | $727 |
Source: Naples Area Board of REALTORS® (NABOR®) MLS, via InfoSparks. Data through June 2026. Data deemed reliable but not guaranteed.
See how many homes are available in Park Shore and how quickly inventory is moving. Months of supply indicates whether conditions favor buyers or sellers.
Homes For Sale
151 as of June 2026, down 22.2% year-over-year.
| Month | Homes For Sale |
|---|---|
| July 2025 | 164 |
| August 2025 | 157 |
| September 2025 | 150 |
| October 2025 | 188 |
| November 2025 | 210 |
| December 2025 | 203 |
| January 2026 | 223 |
| February 2026 | 224 |
| March 2026 | 226 |
| April 2026 | 203 |
| May 2026 | 160 |
| June 2026 | 151 |
Source: Naples Area Board of REALTORS® (NABOR®) MLS, via InfoSparks. Data through June 2026. Data deemed reliable but not guaranteed.
Months Supply
7.8 as of May 2026, down 54.4% year-over-year.
| Month | Months Supply |
|---|---|
| June 2025 | 13.1 |
| July 2025 | 10.9 |
| August 2025 | 10.4 |
| September 2025 | 9.8 |
| October 2025 | 12.5 |
| November 2025 | 13.6 |
| December 2025 | 12.6 |
| January 2026 | 13.5 |
| February 2026 | 13.7 |
| March 2026 | 12.4 |
| April 2026 | 10.6 |
| May 2026 | 7.8 |
Source: Naples Area Board of REALTORS® (NABOR®) MLS, via InfoSparks. Data through May 2026. Data deemed reliable but not guaranteed.
Homes For Sale
151 as of June 2026, down 22.2% year-over-year.
| Month | Homes For Sale |
|---|---|
| July 2025 | 164 |
| August 2025 | 157 |
| September 2025 | 150 |
| October 2025 | 188 |
| November 2025 | 210 |
| December 2025 | 203 |
| January 2026 | 223 |
| February 2026 | 224 |
| March 2026 | 226 |
| April 2026 | 203 |
| May 2026 | 160 |
| June 2026 | 151 |
Source: Naples Area Board of REALTORS® (NABOR®) MLS, via InfoSparks. Data through June 2026. Data deemed reliable but not guaranteed.
7.8 as of May 2026, down 54.4% year-over-year.
| Month | Months Supply |
|---|---|
| June 2025 | 13.1 |
| July 2025 | 10.9 |
| August 2025 | 10.4 |
| September 2025 | 9.8 |
| October 2025 | 12.5 |
| November 2025 | 13.6 |
| December 2025 | 12.6 |
| January 2026 | 13.5 |
| February 2026 | 13.7 |
| March 2026 | 12.4 |
| April 2026 | 10.6 |
| May 2026 | 7.8 |
Source: Naples Area Board of REALTORS® (NABOR®) MLS, via InfoSparks. Data through May 2026. Data deemed reliable but not guaranteed.
Monitor real estate transaction volume in Park Shore. Pending and closed sales reflect the pace of buyer demand and overall market momentum.
Pending Sales
9 as of June 2026, down 43.8% year-over-year.
| Month | Pending Sales |
|---|---|
| July 2025 | 16 |
| August 2025 | 6 |
| September 2025 | 10 |
| October 2025 | 14 |
| November 2025 | 16 |
| December 2025 | 17 |
| January 2026 | 22 |
| February 2026 | 44 |
| March 2026 | 31 |
| April 2026 | 33 |
| May 2026 | 23 |
| June 2026 | 9 |
Source: Naples Area Board of REALTORS® (NABOR®) MLS, via InfoSparks. Data through June 2026. Data deemed reliable but not guaranteed.
Total Sales
34 as of May 2026, up 78.9% year-over-year.
| Month | Total Sales |
|---|---|
| June 2025 | 22 |
| July 2025 | 15 |
| August 2025 | 14 |
| September 2025 | 11 |
| October 2025 | 8 |
| November 2025 | 12 |
| December 2025 | 20 |
| January 2026 | 17 |
| February 2026 | 18 |
| March 2026 | 39 |
| April 2026 | 35 |
| May 2026 | 34 |
Source: Naples Area Board of REALTORS® (NABOR®) MLS, via InfoSparks. Data through May 2026. Data deemed reliable but not guaranteed.
Pending Sales
9 as of June 2026, down 43.8% year-over-year.
| Month | Pending Sales |
|---|---|
| July 2025 | 16 |
| August 2025 | 6 |
| September 2025 | 10 |
| October 2025 | 14 |
| November 2025 | 16 |
| December 2025 | 17 |
| January 2026 | 22 |
| February 2026 | 44 |
| March 2026 | 31 |
| April 2026 | 33 |
| May 2026 | 23 |
| June 2026 | 9 |
Source: Naples Area Board of REALTORS® (NABOR®) MLS, via InfoSparks. Data through June 2026. Data deemed reliable but not guaranteed.
34 as of May 2026, up 78.9% year-over-year.
| Month | Total Sales |
|---|---|
| June 2025 | 22 |
| July 2025 | 15 |
| August 2025 | 14 |
| September 2025 | 11 |
| October 2025 | 8 |
| November 2025 | 12 |
| December 2025 | 20 |
| January 2026 | 17 |
| February 2026 | 18 |
| March 2026 | 39 |
| April 2026 | 35 |
| May 2026 | 34 |
Source: Naples Area Board of REALTORS® (NABOR®) MLS, via InfoSparks. Data through May 2026. Data deemed reliable but not guaranteed.
Luxury beachfront condominium in Park Shore with spacious residences and Gulf views.
Exclusive 28-residence beachfront high-rise in Park Shore offering estate-sized condos with panoramic Gulf and bay views.
 building
Ultra-luxury beachfront condominium in Park Shore with 37 exclusive residences offering 6,000+ sq ft of living space.