Le Parc
Gated · Sold $2M – $12.5M
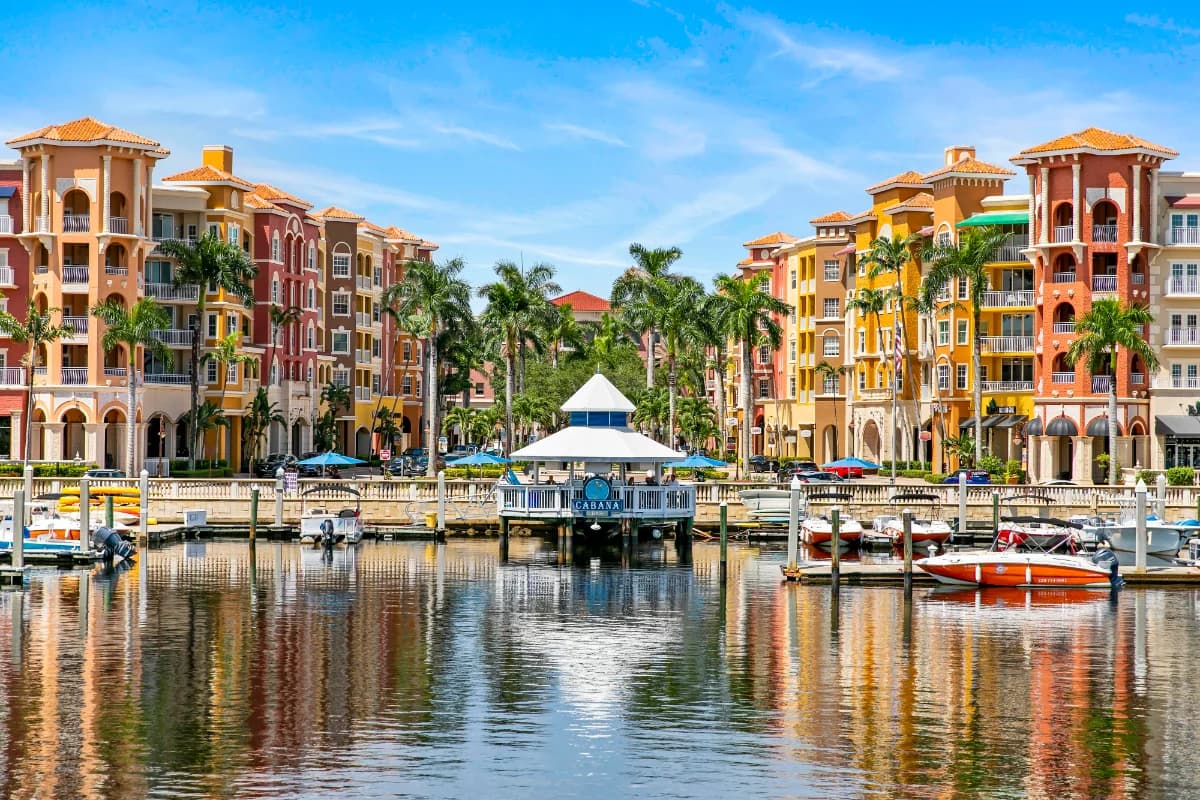
Le Parc's 78 condominium homes share a single tower at the north end of Park Shore in Naples, addressed 4951 Gulf Shore Boulevard North. The Lutgert Companies developed it, and it was finished in 1990. A single condominium association governs the building, directed by its board, with management on the property around the clock.
This building holds two markets, and the tier you buy into decides almost everything else. Most lower-floor homes have 2 bedrooms, while the 10 penthouses at the top have 5, and a penthouse sells for several times what a lower-floor home does. Size, price and the association's assessment all follow that split, so a number for the building as a whole says little about either tier.
How is Le Parc laid out?
The developer describes the tower as designed with "four residences on each of the 17 lower floors and two penthouses on each of the five top floors." That works out to 10 penthouses among the 78 homes, stacked two to a floor above the 17 floors of four.
The penthouses are by far the largest plans in the tower, and the lower floors hold the more compact ones, mostly with 2 bedrooms. When comparing prices, set a lower-floor home against other lower-floor sales and a penthouse against penthouse sales. Averaging the two blurs both.
Every home has a private lanai. The building looks over both the Gulf of Mexico and Venetian Bay, and which of the two a given home sees best depends on where it sits in the tower. Check the view from that home's own lanai before counting on either.
What does the building have on site?
The building's own facilities are these:
- a heated pool with Gulf views, and a spa beside it
- one Har-Tru tennis court
- a fitness center with separate saunas for men and for women
- a card room for billiards and ping pong
- a social room equipped with a catering kitchen
Entry is through the building's own front gate, which controls access to Le Parc alone. The association describes "a private front gate, 24/7 security staff, and an on-site manager," and there's a front desk too.
Covered parking in Le Parc's garage comes with every home. Ask how many spaces go with the specific home, and on what terms, before you sign.
How far is Venetian Village?
About three quarters of a mile to the south, measured on a straight line, and the drive there is no shorter. Venetian Village is the cluster of shops and restaurants on Venetian Bay, the same water the building looks over.
What will the assessment be?
It depends on the home, and the gap is large. The regular assessment is far from uniform: penthouses carry well over twice what a 2-bedroom home pays. Because no single number describes the building, ask the association what the home you're considering pays, along with the budget it's drawn from.
How does the building's age affect what you'll pay?
Finished in 1990, Le Parc is old enough that Florida's structural inspection requirement for condominium towers has already reached it, and a tower like this must also fund reserves for its structural components. Those two obligations are where a steady assessment and a surprise bill part ways.
The association holds the three documents that tell the two apart: the latest structural inspection, the reserve study that rests on it, and the year's budget. Read together, they show whether owners keep paying the present assessment or face an extra levy. Ask for all three, and go through them while the contract is still in its inspection period.
Can you keep a pet or rent the home out?
Only the association can say. Its rules on pets, leasing and similar matters sit in an owners' handbook that isn't published, so the answers have to come from the association directly. Leasing is governed by those rules, which is reason enough to read them before counting on rental income. The handbook is kept behind a residents' login rather than on the association's public website.
Quick Facts
- Home Prices
- Sold $2M – $12.5M
- Gated
- Yes
- Residences
- 78 condominiums, 10 of them penthouses; about 2,300–5,950 sq ft
- Location
- 4951 Gulf Shore Blvd N, north end of Park Shore
- Established
- 1990, developed by The Lutgert Companies
- Bedrooms
- Mostly 2; penthouses 5
Properties for Sale
Market Snapshot
The months supply of homes for sale for condos in Le Parc, Park Shore, Naples was 1 month in September 2026, a decrease from 2 months in September 2025, according to NABOR MLS data through September 2026. This indicates a tightening market compared to a year ago. For all property types, the months supply was also 1 month in September 2026, down from 2 months in September 2025. Total sales of condos in Le Parc were 0 in September 2026, the same as in September 2025. There was 1 condo sale in July 2026 and 1 in May 2026. The median closed price for condos was $2,500,000 in July 2026, based on 1 closed sale. For all property types, there were no closed sales in September 2026. Inventory for condos in Le Parc stood at 1 home for sale in September 2026, a decrease from 3 homes for sale in September 2025. Pending sales for condos were 0 in September 2026, unchanged from September 2025. The median price per square foot for condos was $913 in July 2026, based on 1 closed sale.
October 2026 · Last updated Oct 2, 2026
Pricing
Track how home values are trending in Le Parc. Median sale prices and price-per-square-foot data help buyers and sellers gauge current market positioning.
Median Closed Price
$2,500,000 as of July 2026.
View monthly data
| Month | Median Closed Price |
|---|---|
| April 2023 | $3,301,000 |
| July 2023 | $3,400,000 |
| March 2024 | $8,750,000 |
| November 2024 | $6,525,000 |
| December 2024 | $2,750,000 |
| February 2025 | $6,768,750 |
| May 2025 | $3,020,000 |
| February 2026 | $2,650,000 |
| March 2026 | $12,000,000 |
| April 2026 | $2,000,000 |
| May 2026 | $12,500,000 |
| July 2026 | $2,500,000 |
Source: Naples Area Board of REALTORS® (NABOR®) MLS, via InfoSparks. Data through July 2026. Data deemed reliable but not guaranteed.
Median Prices per Sq ft
$913 as of July 2026.
View monthly data
| Month | Median Prices per Sq ft |
|---|---|
| April 2023 | $1,412 |
| July 2023 | $1,457 |
| March 2024 | $2,364 |
| November 2024 | $1,530 |
| December 2024 | $1,030 |
| February 2025 | $1,388 |
| May 2025 | $1,132 |
| February 2026 | $1,134 |
| March 2026 | $2,168 |
| April 2026 | $638 |
| May 2026 | $2,108 |
| July 2026 | $913 |
Source: Naples Area Board of REALTORS® (NABOR®) MLS, via InfoSparks. Data through July 2026. Data deemed reliable but not guaranteed.
Median Closed Price
$2,500,000 as of July 2026.
View monthly data
| Month | Median Closed Price |
|---|---|
| April 2023 | $3,301,000 |
| July 2023 | $3,400,000 |
| March 2024 | $8,750,000 |
| November 2024 | $6,525,000 |
| December 2024 | $2,750,000 |
| February 2025 | $6,768,750 |
| May 2025 | $3,020,000 |
| February 2026 | $2,650,000 |
| March 2026 | $12,000,000 |
| April 2026 | $2,000,000 |
| May 2026 | $12,500,000 |
| July 2026 | $2,500,000 |
Source: Naples Area Board of REALTORS® (NABOR®) MLS, via InfoSparks. Data through July 2026. Data deemed reliable but not guaranteed.
$913 as of July 2026.
View monthly data
| Month | Median Prices per Sq ft |
|---|---|
| April 2023 | $1,412 |
| July 2023 | $1,457 |
| March 2024 | $2,364 |
| November 2024 | $1,530 |
| December 2024 | $1,030 |
| February 2025 | $1,388 |
| May 2025 | $1,132 |
| February 2026 | $1,134 |
| March 2026 | $2,168 |
| April 2026 | $638 |
| May 2026 | $2,108 |
| July 2026 | $913 |
Source: Naples Area Board of REALTORS® (NABOR®) MLS, via InfoSparks. Data through July 2026. Data deemed reliable but not guaranteed.
Inventory
See how many homes are available in Le Parc and how quickly inventory is moving. Months of supply indicates whether conditions favor buyers or sellers.
Homes For Sale
1 as of September 2026, down 66.7% year-over-year.
View monthly data
| Month | Homes For Sale |
|---|---|
| October 2025 | 3 |
| November 2025 | 5 |
| December 2025 | 5 |
| January 2026 | 6 |
| February 2026 | 4 |
| March 2026 | 4 |
| April 2026 | 4 |
| May 2026 | 3 |
| June 2026 | 1 |
| July 2026 | 1 |
| August 2026 | 1 |
| September 2026 | 1 |
Source: Naples Area Board of REALTORS® (NABOR®) MLS, via InfoSparks. Data through September 2026. Data deemed reliable but not guaranteed.
Months Supply
1 as of September 2026, down 50.0% year-over-year.
View monthly data
| Month | Months Supply |
|---|---|
| October 2025 | 2 |
| November 2025 | 3.8 |
| December 2025 | 3.3 |
| January 2026 | 4 |
| February 2026 | 4 |
| March 2026 | 4 |
| April 2026 | 4 |
| May 2026 | 3 |
| June 2026 | 1 |
| July 2026 | 1 |
| August 2026 | 1 |
| September 2026 | 1 |
Source: Naples Area Board of REALTORS® (NABOR®) MLS, via InfoSparks. Data through September 2026. Data deemed reliable but not guaranteed.
Homes For Sale
1 as of September 2026, down 66.7% year-over-year.
View monthly data
| Month | Homes For Sale |
|---|---|
| October 2025 | 3 |
| November 2025 | 5 |
| December 2025 | 5 |
| January 2026 | 6 |
| February 2026 | 4 |
| March 2026 | 4 |
| April 2026 | 4 |
| May 2026 | 3 |
| June 2026 | 1 |
| July 2026 | 1 |
| August 2026 | 1 |
| September 2026 | 1 |
Source: Naples Area Board of REALTORS® (NABOR®) MLS, via InfoSparks. Data through September 2026. Data deemed reliable but not guaranteed.
1 as of September 2026, down 50.0% year-over-year.
View monthly data
| Month | Months Supply |
|---|---|
| October 2025 | 2 |
| November 2025 | 3.8 |
| December 2025 | 3.3 |
| January 2026 | 4 |
| February 2026 | 4 |
| March 2026 | 4 |
| April 2026 | 4 |
| May 2026 | 3 |
| June 2026 | 1 |
| July 2026 | 1 |
| August 2026 | 1 |
| September 2026 | 1 |
Source: Naples Area Board of REALTORS® (NABOR®) MLS, via InfoSparks. Data through September 2026. Data deemed reliable but not guaranteed.
Activity
Monitor real estate transaction volume in Le Parc. Pending and closed sales reflect the pace of buyer demand and overall market momentum.
Pending Sales
0 as of September 2026.
View monthly data
| Month | Pending Sales |
|---|---|
| October 2025 | 0 |
| November 2025 | 0 |
| December 2025 | 0 |
| January 2026 | 1 |
| February 2026 | 2 |
| March 2026 | 1 |
| April 2026 | 0 |
| May 2026 | 0 |
| June 2026 | 1 |
| July 2026 | 0 |
| August 2026 | 0 |
| September 2026 | 0 |
Source: Naples Area Board of REALTORS® (NABOR®) MLS, via InfoSparks. Data through September 2026. Data deemed reliable but not guaranteed.
Total Sales
0 as of September 2026.
View monthly data
| Month | Total Sales |
|---|---|
| October 2025 | 0 |
| November 2025 | 0 |
| December 2025 | 0 |
| January 2026 | 0 |
| February 2026 | 1 |
| March 2026 | 1 |
| April 2026 | 1 |
| May 2026 | 1 |
| June 2026 | 0 |
| July 2026 | 1 |
| August 2026 | 0 |
| September 2026 | 0 |
Source: Naples Area Board of REALTORS® (NABOR®) MLS, via InfoSparks. Data through September 2026. Data deemed reliable but not guaranteed.
Pending Sales
0 as of September 2026.
View monthly data
| Month | Pending Sales |
|---|---|
| October 2025 | 0 |
| November 2025 | 0 |
| December 2025 | 0 |
| January 2026 | 1 |
| February 2026 | 2 |
| March 2026 | 1 |
| April 2026 | 0 |
| May 2026 | 0 |
| June 2026 | 1 |
| July 2026 | 0 |
| August 2026 | 0 |
| September 2026 | 0 |
Source: Naples Area Board of REALTORS® (NABOR®) MLS, via InfoSparks. Data through September 2026. Data deemed reliable but not guaranteed.
0 as of September 2026.
View monthly data
| Month | Total Sales |
|---|---|
| October 2025 | 0 |
| November 2025 | 0 |
| December 2025 | 0 |
| January 2026 | 0 |
| February 2026 | 1 |
| March 2026 | 1 |
| April 2026 | 1 |
| May 2026 | 1 |
| June 2026 | 0 |
| July 2026 | 1 |
| August 2026 | 0 |
| September 2026 | 0 |
Source: Naples Area Board of REALTORS® (NABOR®) MLS, via InfoSparks. Data through September 2026. Data deemed reliable but not guaranteed.
