Lbuilding
Naples • Park Shore
Le Jardin
Luxury beachfront condominium in Park Shore with spacious residences and Gulf views.
Gated
Park Shore Landings is a bayfront condominium community located at the northwest corner of Crayton Road and Park Shore Drive in Naples'' prestigious Park Shore neighborhood. Built by Ericksen Communities from 1984 to 1986, this low-rise community features four buildings with 72 residences overlooking the waters of Venetian Bay.
Situated directly across from The Village on Venetian Bay, Park Shore Landings offers exceptional water views from every residence. The Gulf beach is just minutes away, accessible through the private, gated Park Shore Association Beach Park, which provides exclusive beach access and parking for residents.
The community consists of four low-rise buildings, each containing 18 units. Condominiums range from 1,372 to approximately 1,800 square feet of living area, with each residence enjoying views across Venetian Bay. The buildings feature covered parking with additional storage areas in front of each carport.
Park Shore Landings offers a resort-style pool and hot tub, party room, and barbecue grills for resident enjoyment. The waterfront location provides 36 boat slips, a scenic boardwalk along the bay, and a fishing platform. The separate clubhouse facility serves as a social hub for the community.
The community allows pets with approval, restricted to one pet under 20 pounds. Specific rental policies should be confirmed with the property management office.
Track how home values are trending in Park Shore Landings. Median sale prices and price-per-square-foot data help buyers and sellers gauge current market positioning.
Median Prices per Sq ft
$910 as of March 2026.
| Month | Median Prices per Sq ft |
|---|---|
| April 2023 | $822 |
| May 2023 | $1,152 |
| September 2023 | $916 |
| October 2023 | $823 |
| April 2024 | $700 |
| May 2024 | $893 |
| June 2024 | $1,190 |
| January 2025 | $840 |
| February 2025 | $785 |
| June 2025 | $789 |
| March 2026 | $910 |
Source: Naples Area Board of REALTORS® (NABOR®) MLS, via InfoSparks. Data through March 2026. Data deemed reliable but not guaranteed.
Median Prices per Sq ft
$910 as of March 2026.
| Month | Median Prices per Sq ft |
|---|---|
| April 2023 | $822 |
| May 2023 | $1,152 |
| September 2023 | $916 |
| October 2023 | $823 |
| April 2024 | $700 |
| May 2024 | $893 |
| June 2024 | $1,190 |
| January 2025 | $840 |
| February 2025 | $785 |
| June 2025 | $789 |
| March 2026 | $910 |
Source: Naples Area Board of REALTORS® (NABOR®) MLS, via InfoSparks. Data through March 2026. Data deemed reliable but not guaranteed.
See how many homes are available in Park Shore Landings and how quickly inventory is moving. Months of supply indicates whether conditions favor buyers or sellers.
Homes For Sale
1 as of June 2026, down 66.7% year-over-year.
| Month | Homes For Sale |
|---|---|
| July 2025 | 4 |
| August 2025 | 4 |
| September 2025 | 4 |
| October 2025 | 4 |
| November 2025 | 6 |
| December 2025 | 5 |
| January 2026 | 3 |
| February 2026 | 3 |
| March 2026 | 2 |
| April 2026 | 2 |
| May 2026 | 2 |
| June 2026 | 1 |
Source: Naples Area Board of REALTORS® (NABOR®) MLS, via InfoSparks. Data through June 2026. Data deemed reliable but not guaranteed.
Months Supply
0.5 as of June 2026, down 72.2% year-over-year.
| Month | Months Supply |
|---|---|
| July 2025 | 2.4 |
| August 2025 | 2.4 |
| September 2025 | 2.4 |
| October 2025 | 2.4 |
| November 2025 | 3.6 |
| December 2025 | 3 |
| January 2026 | 1.5 |
| February 2026 | 3 |
| March 2026 | 1.3 |
| April 2026 | 1.3 |
| May 2026 | 1.3 |
| June 2026 | 0.5 |
Source: Naples Area Board of REALTORS® (NABOR®) MLS, via InfoSparks. Data through June 2026. Data deemed reliable but not guaranteed.
Homes For Sale
1 as of June 2026, down 66.7% year-over-year.
| Month | Homes For Sale |
|---|---|
| July 2025 | 4 |
| August 2025 | 4 |
| September 2025 | 4 |
| October 2025 | 4 |
| November 2025 | 6 |
| December 2025 | 5 |
| January 2026 | 3 |
| February 2026 | 3 |
| March 2026 | 2 |
| April 2026 | 2 |
| May 2026 | 2 |
| June 2026 | 1 |
Source: Naples Area Board of REALTORS® (NABOR®) MLS, via InfoSparks. Data through June 2026. Data deemed reliable but not guaranteed.
0.5 as of June 2026, down 72.2% year-over-year.
| Month | Months Supply |
|---|---|
| July 2025 | 2.4 |
| August 2025 | 2.4 |
| September 2025 | 2.4 |
| October 2025 | 2.4 |
| November 2025 | 3.6 |
| December 2025 | 3 |
| January 2026 | 1.5 |
| February 2026 | 3 |
| March 2026 | 1.3 |
| April 2026 | 1.3 |
| May 2026 | 1.3 |
| June 2026 | 0.5 |
Source: Naples Area Board of REALTORS® (NABOR®) MLS, via InfoSparks. Data through June 2026. Data deemed reliable but not guaranteed.
Monitor real estate transaction volume in Park Shore Landings. Pending and closed sales reflect the pace of buyer demand and overall market momentum.
Pending Sales
0 as of May 2026, down 100.0% year-over-year.
| Month | Pending Sales |
|---|---|
| June 2025 | 0 |
| July 2025 | 0 |
| August 2025 | 0 |
| September 2025 | 0 |
| October 2025 | 0 |
| November 2025 | 0 |
| December 2025 | 0 |
| January 2026 | 2 |
| February 2026 | 0 |
| March 2026 | 0 |
| April 2026 | 1 |
| May 2026 | 0 |
Source: Naples Area Board of REALTORS® (NABOR®) MLS, via InfoSparks. Data through May 2026. Data deemed reliable but not guaranteed.
Total Sales
0 as of June 2026, down 100.0% year-over-year.
| Month | Total Sales |
|---|---|
| July 2025 | 0 |
| August 2025 | 0 |
| September 2025 | 0 |
| October 2025 | 0 |
| November 2025 | 0 |
| December 2025 | 0 |
| January 2026 | 0 |
| February 2026 | 0 |
| March 2026 | 2 |
| April 2026 | 0 |
| May 2026 | 0 |
| June 2026 | 0 |
Source: Naples Area Board of REALTORS® (NABOR®) MLS, via InfoSparks. Data through June 2026. Data deemed reliable but not guaranteed.
Pending Sales
0 as of May 2026, down 100.0% year-over-year.
| Month | Pending Sales |
|---|---|
| June 2025 | 0 |
| July 2025 | 0 |
| August 2025 | 0 |
| September 2025 | 0 |
| October 2025 | 0 |
| November 2025 | 0 |
| December 2025 | 0 |
| January 2026 | 2 |
| February 2026 | 0 |
| March 2026 | 0 |
| April 2026 | 1 |
| May 2026 | 0 |
Source: Naples Area Board of REALTORS® (NABOR®) MLS, via InfoSparks. Data through May 2026. Data deemed reliable but not guaranteed.
0 as of June 2026, down 100.0% year-over-year.
| Month | Total Sales |
|---|---|
| July 2025 | 0 |
| August 2025 | 0 |
| September 2025 | 0 |
| October 2025 | 0 |
| November 2025 | 0 |
| December 2025 | 0 |
| January 2026 | 0 |
| February 2026 | 0 |
| March 2026 | 2 |
| April 2026 | 0 |
| May 2026 | 0 |
| June 2026 | 0 |
Source: Naples Area Board of REALTORS® (NABOR®) MLS, via InfoSparks. Data through June 2026. Data deemed reliable but not guaranteed.
Additional market metrics for Park Shore Landings to help you understand local real estate trends.
Park Shore Landings
$1,480,000 as of March 2026.
| Month | Park Shore Landings |
|---|---|
| April 2023 | $1,450,000 |
| May 2023 | $1,695,000 |
| September 2023 | $1,750,000 |
| October 2023 | $1,295,000 |
| April 2024 | $1,075,000 |
| May 2024 | $1,602,500 |
| June 2024 | $2,100,000 |
| January 2025 | $1,257,000 |
| February 2025 | $1,170,000 |
| June 2025 | $1,400,000 |
| March 2026 | $1,480,000 |
Source: Naples Area Board of REALTORS® (NABOR®) MLS, via InfoSparks. Data through March 2026. Data deemed reliable but not guaranteed.
Park Shore Landings
$1,480,000 as of March 2026.
| Month | Park Shore Landings |
|---|---|
| April 2023 | $1,450,000 |
| May 2023 | $1,695,000 |
| September 2023 | $1,750,000 |
| October 2023 | $1,295,000 |
| April 2024 | $1,075,000 |
| May 2024 | $1,602,500 |
| June 2024 | $2,100,000 |
| January 2025 | $1,257,000 |
| February 2025 | $1,170,000 |
| June 2025 | $1,400,000 |
| March 2026 | $1,480,000 |
Source: Naples Area Board of REALTORS® (NABOR®) MLS, via InfoSparks. Data through March 2026. Data deemed reliable but not guaranteed.
Luxury beachfront condominium in Park Shore with spacious residences and Gulf views.
Exclusive 28-residence beachfront high-rise in Park Shore offering estate-sized condos with panoramic Gulf and bay views.
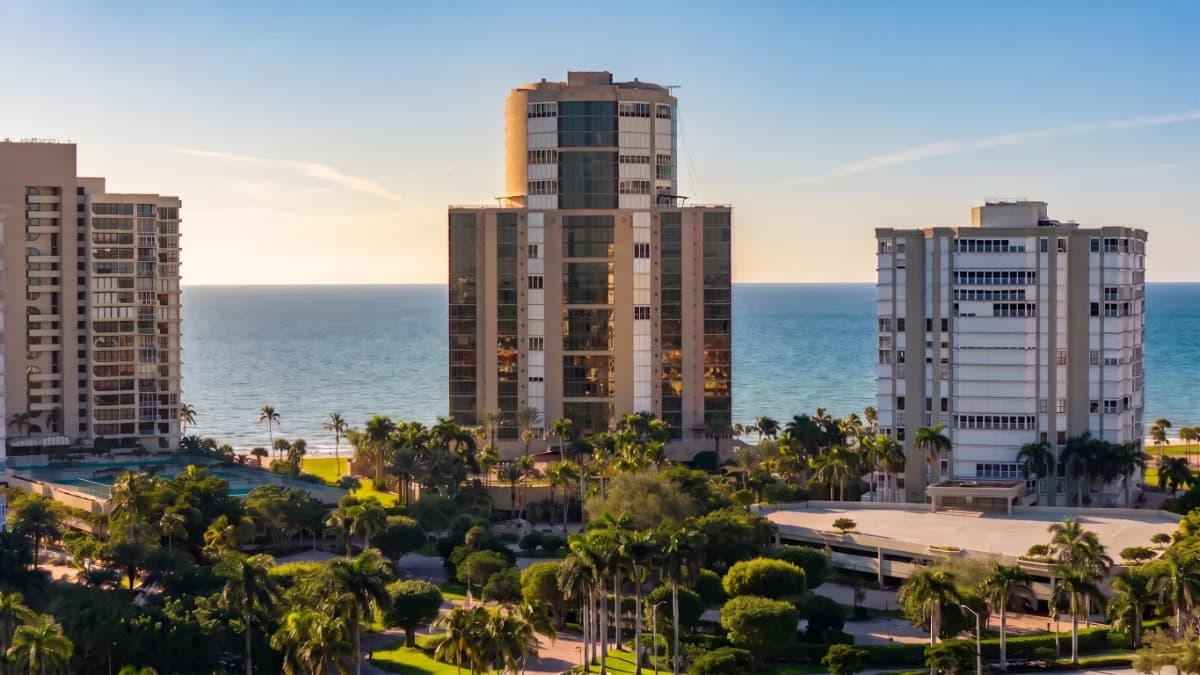 building
Ultra-luxury beachfront condominium in Park Shore with 37 exclusive residences offering 6,000+ sq ft of living space.
Luxury beachfront condominium in Park Shore with spacious residences and Gulf views.
Exclusive 28-residence beachfront high-rise in Park Shore offering estate-sized condos with panoramic Gulf and bay views.
buildingUltra-luxury beachfront condominium in Park Shore with 37 exclusive residences offering 6,000+ sq ft of living space.
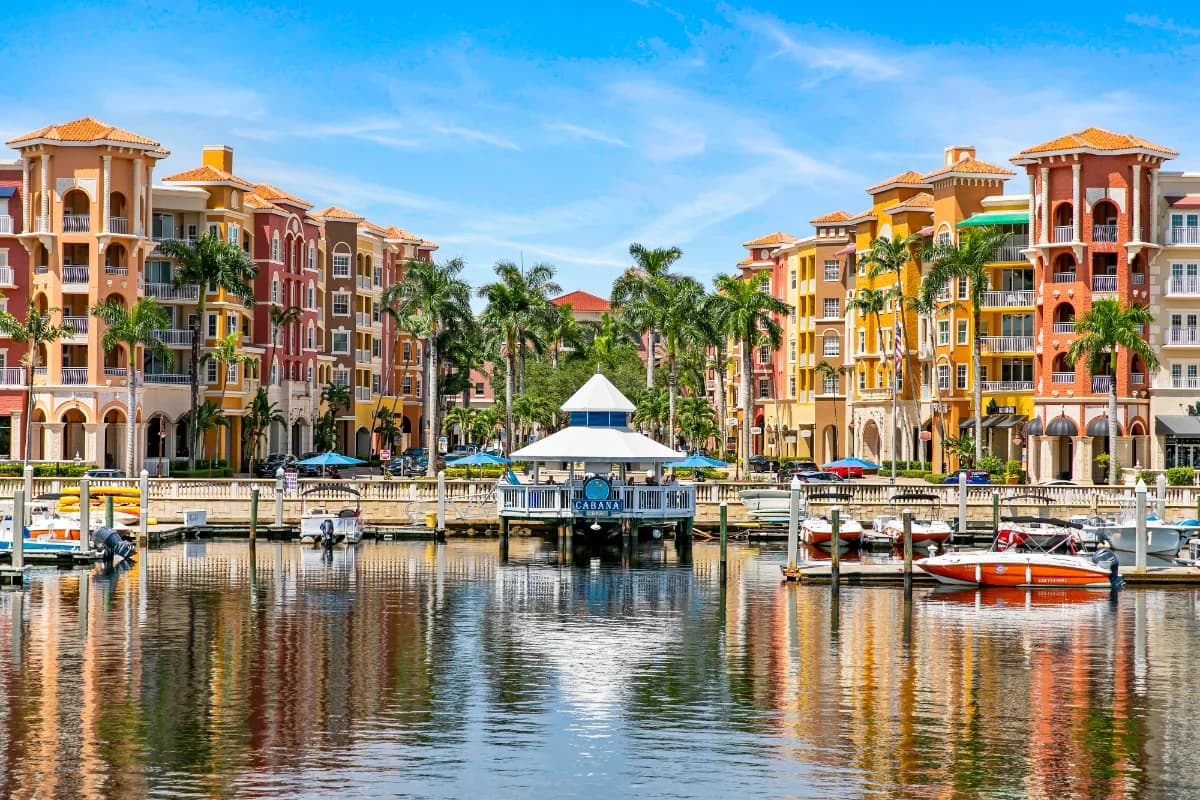 location
World-class beaches, golf, and coastal lifestyle in Southwest Florida.
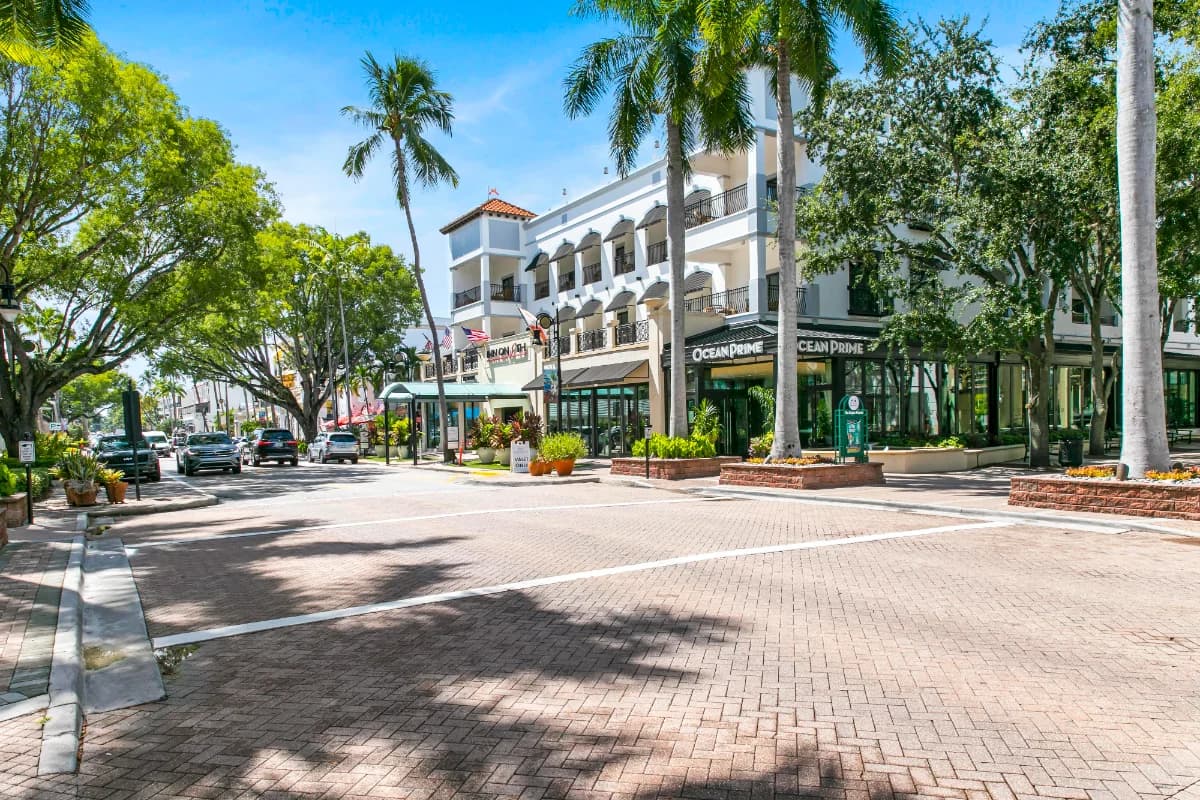 area
area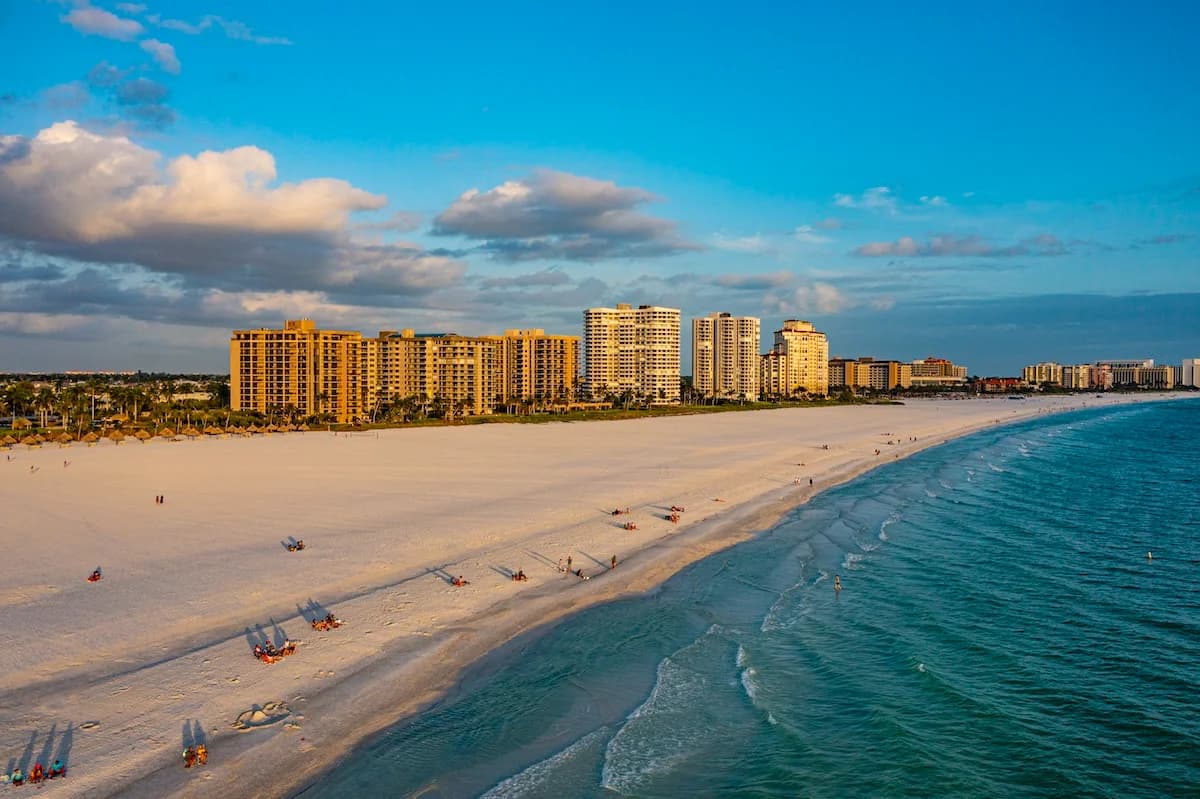 location
Island living with white-sand beaches and boating lifestyle.
locationWorld-class beaches, golf, and coastal lifestyle in Southwest Florida.
arealocationIsland living with white-sand beaches and boating lifestyle.