Pelican Point
Waterfront / boating
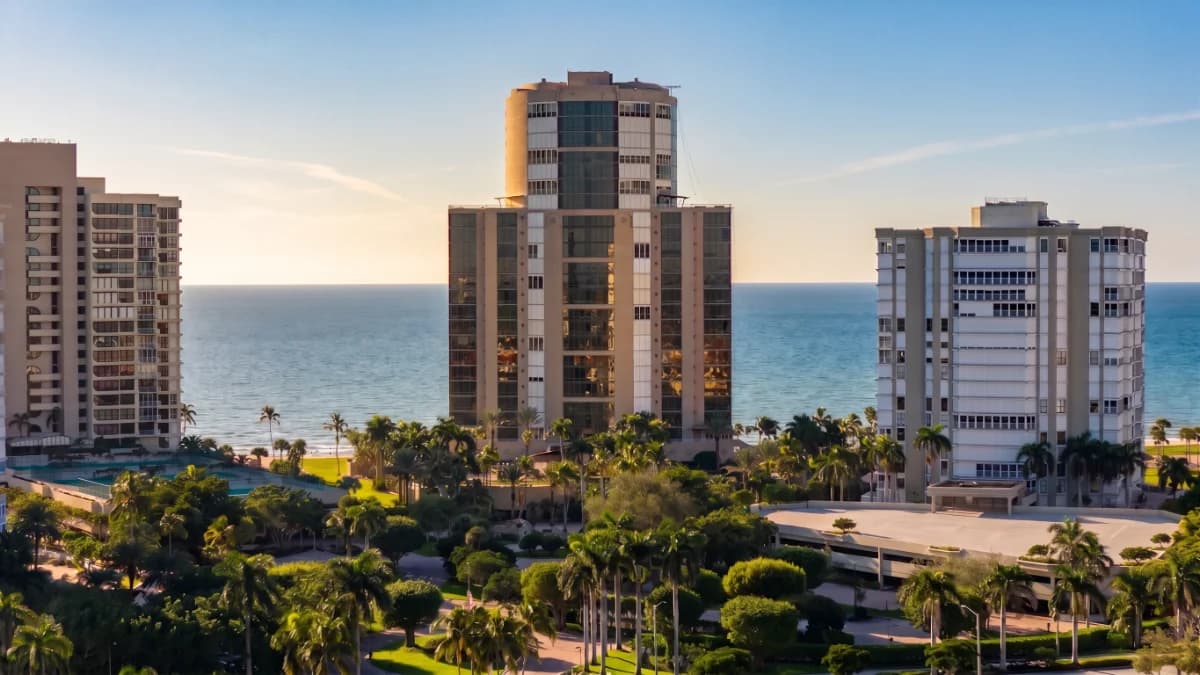
Pelican Point is a waterfront condominium community located on Venetian Bay in the prestigious Park Shore neighborhood of Naples. Built in 1974, this intimate community consists of 36 residential units across six floors, offering southern exposure and stunning bay views.
Location & Lifestyle
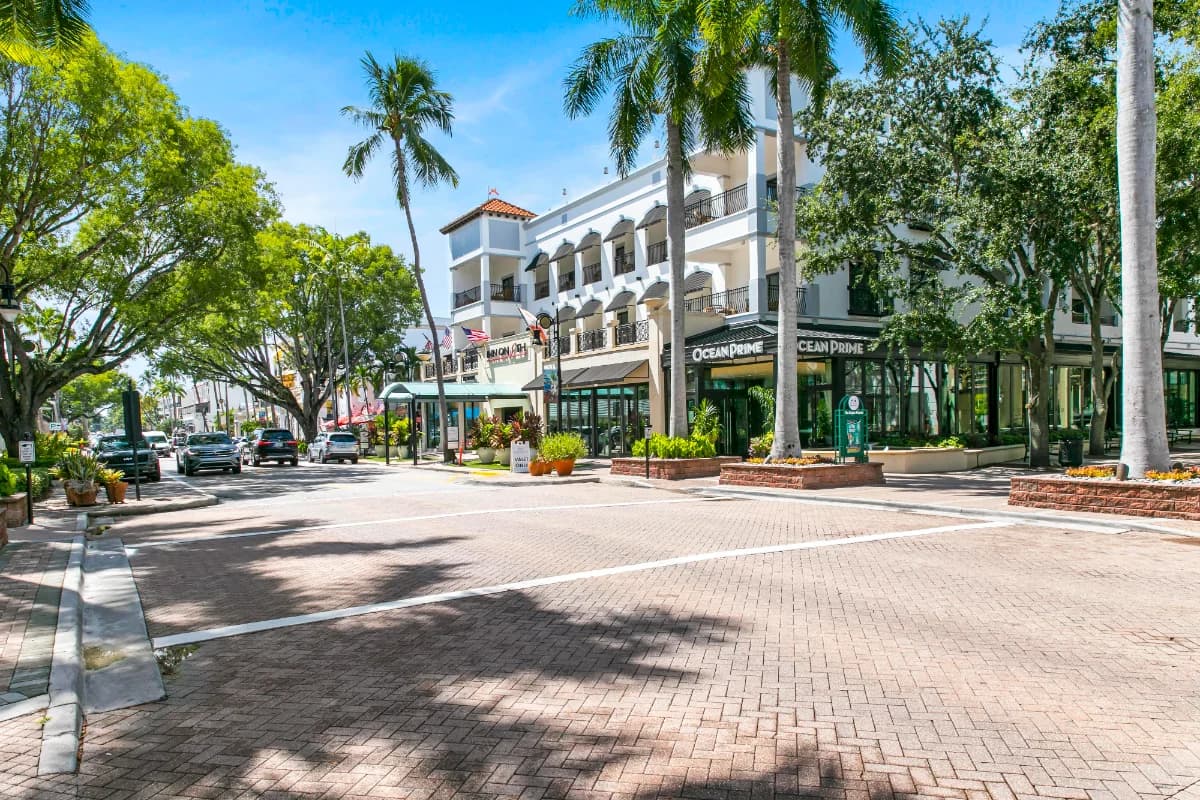
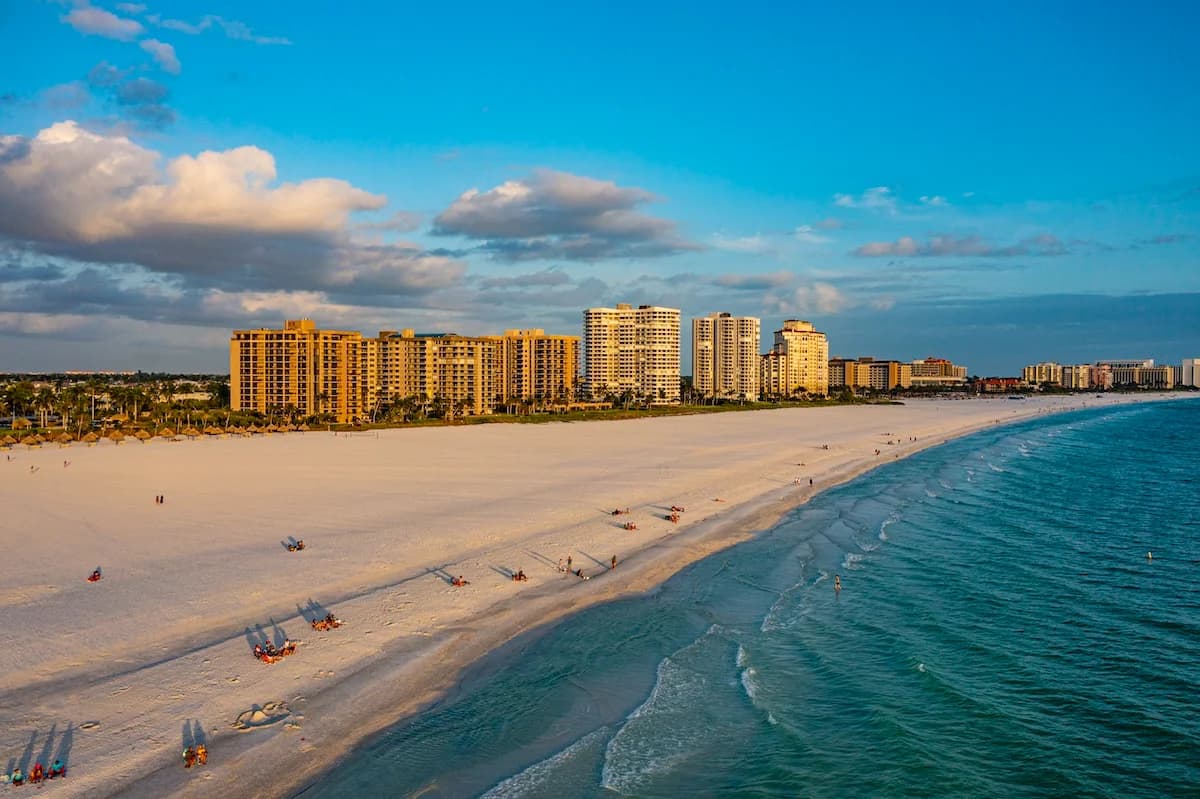
Situated at 300 Park Shore Drive, Pelican Point provides an ideal location for those seeking waterfront living with urban conveniences. Residents can walk to The Village Shops on Venetian Bay for dining and shopping, while enjoying radiant sunsets from their bayfront location. The community offers private beach access through the Park Shore Association.
Residences
The 36 condominiums at Pelican Point range from 1,000 to over 2,000 square feet of living space. Each residence features southern exposure with views of Venetian Bay, and comes with a covered parking spot.
Amenities & Features
Pelican Point offers a bayside pool where residents can relax while enjoying sparkling bay views. The community features boat slips for water enthusiasts, kayak access, and beautifully landscaped grounds. Additional amenities include a party room for gatherings, grilling area, sundeck, and library. The building provides secure entry for peace of mind.
Quick Facts
- Community Type
- Waterfront / boating
- Residences
- 36 condominiums (1,000-2,000+ sq ft)
- Location
- Park Shore, walk to Village Shops
- Established
- 1974
- Lifestyle
- Waterfront living on Venetian Bay
Amenities
Properties for Sale
Market Snapshot
The months supply of homes for sale in Pelican Point, Park Shore, Naples was 0.8 in September 2026, down from 1.7 in September 2025, according to NABOR MLS data through September 2026. This indicates a tightening market, with the months supply for condos also at 0.8 in September 2026, compared to 1.7 in September 2025. Total condo sales in Pelican Point were zero in September 2026. For the full year, two condo sales occurred in March 2026, one in January 2026, one in February 2026, and one in June 2026. Pending condo sales were also zero in September 2026. However, there were two pending condo sales in January 2026, one in February 2026, and one in March 2026. The median closed price for condos in Pelican Point was $530,000 in June 2026, based on a small sample of transactions. The median price per square foot for condos was $549 in June 2026, $649 in March 2026, and $538 in February 2026. Homes for sale in Pelican Point stood at 1 unit in September 2026, which was consistent with August 2026 and July 2026 figures.
October 2026 · Last updated Oct 2, 2026
Pricing
Track how home values are trending in Pelican Point. Median sale prices and price-per-square-foot data help buyers and sellers gauge current market positioning.
Median Closed Price
$530,000 as of June 2026.
View monthly data
| Month | Median Closed Price |
|---|---|
| May 2024 | $640,000 |
| July 2024 | $640,000 |
| December 2024 | $1,160,000 |
| January 2025 | $725,140 |
| February 2025 | $610,000 |
| March 2025 | $910,000 |
| April 2025 | $500,000 |
| May 2025 | $1,050,000 |
| January 2026 | $1,075,000 |
| February 2026 | $565,000 |
| March 2026 | $890,750 |
| June 2026 | $530,000 |
Source: Naples Area Board of REALTORS® (NABOR®) MLS, via InfoSparks. Data through June 2026. Data deemed reliable but not guaranteed.
Median Prices per Sq ft
$549 as of June 2026.
View monthly data
| Month | Median Prices per Sq ft |
|---|---|
| May 2024 | $631 |
| July 2024 | $571 |
| December 2024 | $763 |
| January 2025 | $559 |
| February 2025 | $530 |
| March 2025 | $585 |
| April 2025 | $518 |
| May 2025 | $641 |
| January 2026 | $657 |
| February 2026 | $538 |
| March 2026 | $649 |
| June 2026 | $549 |
Source: Naples Area Board of REALTORS® (NABOR®) MLS, via InfoSparks. Data through June 2026. Data deemed reliable but not guaranteed.
Median Closed Price
$530,000 as of June 2026.
View monthly data
| Month | Median Closed Price |
|---|---|
| May 2024 | $640,000 |
| July 2024 | $640,000 |
| December 2024 | $1,160,000 |
| January 2025 | $725,140 |
| February 2025 | $610,000 |
| March 2025 | $910,000 |
| April 2025 | $500,000 |
| May 2025 | $1,050,000 |
| January 2026 | $1,075,000 |
| February 2026 | $565,000 |
| March 2026 | $890,750 |
| June 2026 | $530,000 |
Source: Naples Area Board of REALTORS® (NABOR®) MLS, via InfoSparks. Data through June 2026. Data deemed reliable but not guaranteed.
$549 as of June 2026.
View monthly data
| Month | Median Prices per Sq ft |
|---|---|
| May 2024 | $631 |
| July 2024 | $571 |
| December 2024 | $763 |
| January 2025 | $559 |
| February 2025 | $530 |
| March 2025 | $585 |
| April 2025 | $518 |
| May 2025 | $641 |
| January 2026 | $657 |
| February 2026 | $538 |
| March 2026 | $649 |
| June 2026 | $549 |
Source: Naples Area Board of REALTORS® (NABOR®) MLS, via InfoSparks. Data through June 2026. Data deemed reliable but not guaranteed.
Inventory
See how many homes are available in Pelican Point and how quickly inventory is moving. Months of supply indicates whether conditions favor buyers or sellers.
Homes For Sale
1 as of September 2026, down 50.0% year-over-year.
View monthly data
| Month | Homes For Sale |
|---|---|
| October 2025 | 3 |
| November 2025 | 5 |
| December 2025 | 3 |
| January 2026 | 2 |
| February 2026 | 2 |
| March 2026 | 1 |
| April 2026 | 2 |
| May 2026 | 2 |
| June 2026 | 2 |
| July 2026 | 1 |
| August 2026 | 1 |
| September 2026 | 1 |
Source: Naples Area Board of REALTORS® (NABOR®) MLS, via InfoSparks. Data through September 2026. Data deemed reliable but not guaranteed.
Months Supply
0.8 as of September 2026, down 52.9% year-over-year.
View monthly data
| Month | Months Supply |
|---|---|
| October 2025 | 2.6 |
| November 2025 | 4.3 |
| December 2025 | 2.5 |
| January 2026 | 2 |
| February 2026 | 2 |
| March 2026 | 0.8 |
| April 2026 | 1.6 |
| May 2026 | 1.5 |
| June 2026 | 1.6 |
| July 2026 | 0.8 |
| August 2026 | 0.8 |
| September 2026 | 0.8 |
Source: Naples Area Board of REALTORS® (NABOR®) MLS, via InfoSparks. Data through September 2026. Data deemed reliable but not guaranteed.
Homes For Sale
1 as of September 2026, down 50.0% year-over-year.
View monthly data
| Month | Homes For Sale |
|---|---|
| October 2025 | 3 |
| November 2025 | 5 |
| December 2025 | 3 |
| January 2026 | 2 |
| February 2026 | 2 |
| March 2026 | 1 |
| April 2026 | 2 |
| May 2026 | 2 |
| June 2026 | 2 |
| July 2026 | 1 |
| August 2026 | 1 |
| September 2026 | 1 |
Source: Naples Area Board of REALTORS® (NABOR®) MLS, via InfoSparks. Data through September 2026. Data deemed reliable but not guaranteed.
0.8 as of September 2026, down 52.9% year-over-year.
View monthly data
| Month | Months Supply |
|---|---|
| October 2025 | 2.6 |
| November 2025 | 4.3 |
| December 2025 | 2.5 |
| January 2026 | 2 |
| February 2026 | 2 |
| March 2026 | 0.8 |
| April 2026 | 1.6 |
| May 2026 | 1.5 |
| June 2026 | 1.6 |
| July 2026 | 0.8 |
| August 2026 | 0.8 |
| September 2026 | 0.8 |
Source: Naples Area Board of REALTORS® (NABOR®) MLS, via InfoSparks. Data through September 2026. Data deemed reliable but not guaranteed.
Activity
Monitor real estate transaction volume in Pelican Point. Pending and closed sales reflect the pace of buyer demand and overall market momentum.
Pending Sales
0 as of September 2026.
View monthly data
| Month | Pending Sales |
|---|---|
| October 2025 | 0 |
| November 2025 | 0 |
| December 2025 | 1 |
| January 2026 | 2 |
| February 2026 | 1 |
| March 2026 | 1 |
| April 2026 | 0 |
| May 2026 | 0 |
| June 2026 | 0 |
| July 2026 | 0 |
| August 2026 | 0 |
| September 2026 | 0 |
Source: Naples Area Board of REALTORS® (NABOR®) MLS, via InfoSparks. Data through September 2026. Data deemed reliable but not guaranteed.
Total Sales
0 as of September 2026.
View monthly data
| Month | Total Sales |
|---|---|
| October 2025 | 0 |
| November 2025 | 0 |
| December 2025 | 0 |
| January 2026 | 1 |
| February 2026 | 1 |
| March 2026 | 2 |
| April 2026 | 0 |
| May 2026 | 0 |
| June 2026 | 1 |
| July 2026 | 0 |
| August 2026 | 0 |
| September 2026 | 0 |
Source: Naples Area Board of REALTORS® (NABOR®) MLS, via InfoSparks. Data through September 2026. Data deemed reliable but not guaranteed.
Pending Sales
0 as of September 2026.
View monthly data
| Month | Pending Sales |
|---|---|
| October 2025 | 0 |
| November 2025 | 0 |
| December 2025 | 1 |
| January 2026 | 2 |
| February 2026 | 1 |
| March 2026 | 1 |
| April 2026 | 0 |
| May 2026 | 0 |
| June 2026 | 0 |
| July 2026 | 0 |
| August 2026 | 0 |
| September 2026 | 0 |
Source: Naples Area Board of REALTORS® (NABOR®) MLS, via InfoSparks. Data through September 2026. Data deemed reliable but not guaranteed.
0 as of September 2026.
View monthly data
| Month | Total Sales |
|---|---|
| October 2025 | 0 |
| November 2025 | 0 |
| December 2025 | 0 |
| January 2026 | 1 |
| February 2026 | 1 |
| March 2026 | 2 |
| April 2026 | 0 |
| May 2026 | 0 |
| June 2026 | 1 |
| July 2026 | 0 |
| August 2026 | 0 |
| September 2026 | 0 |
Source: Naples Area Board of REALTORS® (NABOR®) MLS, via InfoSparks. Data through September 2026. Data deemed reliable but not guaranteed.