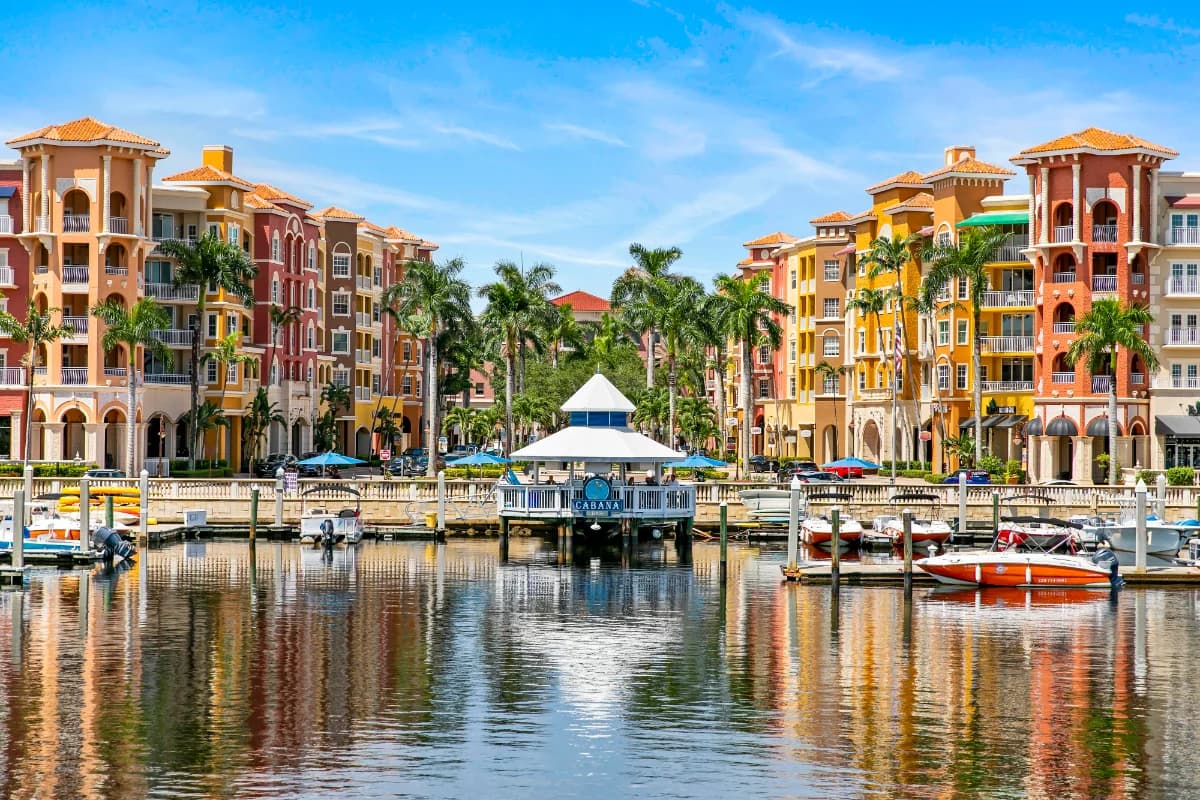
The Terraces
$850,000s – $1.8M · About $2,300–$3,100/mo
The Terraces is one 19-story condominium tower at 4751 Gulf Shore Boulevard North, in Park Shore. It holds 116 homes, it was finished in 1986, and it sits on about three acres. A single association covers all 116 of those homes, with no villas, no second neighborhood and no master board above it.
The build year is what should shape an offer, because the paper trail stops somewhere awkward. Two structural obligations attach to a 1986 condominium tower in Florida. An engineer has to examine the structure and return to it on a cycle. The association must hold a costed engineering study of the parts that wear out: the roof, the plumbing, the wiring, the windows, the waterproofing and the structure itself. The City of Naples enforces the inspection side at this address, and it put The Terraces on its 2024 list. That list records the date the examination was owed and carries no findings at all.
So what did the engineer find?
That isn't on the public record. Collier County keeps a register that carries a status and a next inspection year, but it stops at the city line, so it holds nothing for this address. There's no pass on file here, which also means no repair list travels with one. The absence cuts both ways and should be read as nothing more than absence. What the engineer wrote and the study behind the reserves both sit with the association, and the inspection period is when to read them.
Can the budget tell you where things stand?
Not by itself. Structural reserves can no longer be voted down to nothing, so a funded line is the ordinary expectation. There is a window open until the end of 2028, though. Where the inspection was done inside the previous two years, owners can vote to pause or shrink those reserve payments across as many as two budgets, and the money goes into repairs the inspection called for instead. So a lean reserve line proves nothing on its own. It can mean that little is due, or that the money is being spent on work that is, and a budget alone will not tell you which.
How big are the homes?
There are seven floor plans in the building, and they cover all 116 homes: about 1,190, 1,420, 1,595, 1,615, 1,750, 1,830 and 1,980 square feet. The smallest plan is also the most common, at 27 of the 116. The other six are spread evenly, 14 to 16 homes apiece. So a search here is a choice between seven known layouts rather than 116 separate ones, and a plan you liked and lost will come round again.
Where does the building sit?
On the Gulf side of Gulf Shore Boulevard North. The Gulf of Mexico is west of the tower and Venetian Bay east of it. What any one home looks out at depends on its stack and its floor, so read that as a position on the map rather than a promise about a window. Venetian Village is about two thirds of a mile off and Waterside Shops about nine tenths. Both of those are straight lines, and Gulf Shore Boulevard bends around the bay, so the real route is longer than either.
Can you keep a boat at The Terraces?
Not as part of the condominium. The slips near the building belong to Venetian Bay North Yacht Club, a separate 1988 condominium at its own addresses on the same street, with 74 individually owned slips. Not one of the 116 homes at The Terraces carries a slip, a dock or a marina with it. A boat means a second purchase on its own terms, priced apart from the home.
What do homes here sell for?
Homes at The Terraces have sold from the $850,000s to around $1.8 million. The range describes what has traded, not what's available. For the association fee, budget between about $2,300 and about $3,100 a month, and plan nearer the top of that than the bottom.
What should be read before an offer?
Four documents, all of them held by the association:
- What the engineer wrote about the structure.
- The reserve study, with the figure it puts on the work.
- The budget, and whether the reserve line in it matches the study.
- The pet rule, which only the association's documents settle.
Nothing at this address is still being built: one tower, one construction date, and 1986 on all 116 homes.
Quick Facts
- Home Prices
- $850,000s – $1.8M
- Monthly Fees
- About $2,300–$3,100/mo
- Residences
- 116 condominiums in one 19-story tower
- Location
- 4751 Gulf Shore Blvd. N, Park Shore
- Established
- 1986
- Bedrooms
- 2–3 (in the eleven homes with listing records)
- Floor Plans
- Seven, about 1,190 to 1,980 sq ft
Properties for Sale
Market Snapshot
The median closed price for condos in The Terraces, Park Shore, Naples was $1,000,000 in September 2026, down 44.4% from $1,800,000 a year earlier, according to NABOR MLS data through September 2026. For all property types, the median price per square foot was $799 in September 2026, down from $1,102 in September 2025. These figures are based on a small sample of transactions. Condo inventory in The Terraces totaled 3 units for sale in September 2026, down from 5 units in September 2025. This contributed to a months supply of inventory for condos of 3 months in September 2026, a decrease from 3.8 months in September 2025. There were 3 pending condo sales in September 2026, compared to no pending sales in September 2025. Total condo sales in September 2026 were 1, which was the same as September 2025.
October 2026 · Last updated Oct 2, 2026
Pricing
Track how home values are trending in The Terraces. Median sale prices and price-per-square-foot data help buyers and sellers gauge current market positioning.
Median Closed Price
$1,000,000 as of September 2026, down 44.4% year-over-year.
View monthly data
| Month | Median Closed Price |
|---|---|
| April 2023 | $1,412,500 |
| August 2023 | $1,250,000 |
| December 2023 | $950,000 |
| April 2024 | $1,400,000 |
| May 2024 | $2,350,000 |
| June 2025 | $1,387,500 |
| August 2025 | $1,050,000 |
| September 2025 | $1,800,000 |
| March 2026 | $850,000 |
| May 2026 | $1,399,900 |
| June 2026 | $1,050,000 |
| September 2026 | $1,000,000 |
Source: Naples Area Board of REALTORS® (NABOR®) MLS, via InfoSparks. Data through September 2026. Data deemed reliable but not guaranteed.
Median Prices per Sq ft
$799 as of September 2026, down 27.5% year-over-year.
View monthly data
| Month | Median Prices per Sq ft |
|---|---|
| April 2023 | $1,128 |
| August 2023 | $998 |
| December 2023 | $759 |
| April 2024 | $976 |
| May 2024 | $1,438 |
| June 2025 | $746 |
| August 2025 | $839 |
| September 2025 | $1,102 |
| March 2026 | $597 |
| May 2026 | $763 |
| June 2026 | $839 |
| September 2026 | $799 |
Source: Naples Area Board of REALTORS® (NABOR®) MLS, via InfoSparks. Data through September 2026. Data deemed reliable but not guaranteed.
Median Closed Price
$1,000,000 as of September 2026, down 44.4% year-over-year.
View monthly data
| Month | Median Closed Price |
|---|---|
| April 2023 | $1,412,500 |
| August 2023 | $1,250,000 |
| December 2023 | $950,000 |
| April 2024 | $1,400,000 |
| May 2024 | $2,350,000 |
| June 2025 | $1,387,500 |
| August 2025 | $1,050,000 |
| September 2025 | $1,800,000 |
| March 2026 | $850,000 |
| May 2026 | $1,399,900 |
| June 2026 | $1,050,000 |
| September 2026 | $1,000,000 |
Source: Naples Area Board of REALTORS® (NABOR®) MLS, via InfoSparks. Data through September 2026. Data deemed reliable but not guaranteed.
$799 as of September 2026, down 27.5% year-over-year.
View monthly data
| Month | Median Prices per Sq ft |
|---|---|
| April 2023 | $1,128 |
| August 2023 | $998 |
| December 2023 | $759 |
| April 2024 | $976 |
| May 2024 | $1,438 |
| June 2025 | $746 |
| August 2025 | $839 |
| September 2025 | $1,102 |
| March 2026 | $597 |
| May 2026 | $763 |
| June 2026 | $839 |
| September 2026 | $799 |
Source: Naples Area Board of REALTORS® (NABOR®) MLS, via InfoSparks. Data through September 2026. Data deemed reliable but not guaranteed.
Inventory
See how many homes are available in The Terraces and how quickly inventory is moving. Months of supply indicates whether conditions favor buyers or sellers.
Homes For Sale
4 as of September 2026, down 20.0% year-over-year.
View monthly data
| Month | Homes For Sale |
|---|---|
| October 2025 | 5 |
| November 2025 | 4 |
| December 2025 | 4 |
| January 2026 | 3 |
| February 2026 | 5 |
| March 2026 | 5 |
| April 2026 | 7 |
| May 2026 | 6 |
| June 2026 | 6 |
| July 2026 | 6 |
| August 2026 | 7 |
| September 2026 | 4 |
Source: Naples Area Board of REALTORS® (NABOR®) MLS, via InfoSparks. Data through September 2026. Data deemed reliable but not guaranteed.
Months Supply
4 as of September 2026, up 5.3% year-over-year.
View monthly data
| Month | Months Supply |
|---|---|
| October 2025 | 3.8 |
| November 2025 | 3 |
| December 2025 | 3 |
| January 2026 | 2.3 |
| February 2026 | 3.8 |
| March 2026 | 4 |
| April 2026 | 5.6 |
| May 2026 | 5 |
| June 2026 | 6 |
| July 2026 | 6 |
| August 2026 | 7 |
| September 2026 | 4 |
Source: Naples Area Board of REALTORS® (NABOR®) MLS, via InfoSparks. Data through September 2026. Data deemed reliable but not guaranteed.
Homes For Sale
4 as of September 2026, down 20.0% year-over-year.
View monthly data
| Month | Homes For Sale |
|---|---|
| October 2025 | 5 |
| November 2025 | 4 |
| December 2025 | 4 |
| January 2026 | 3 |
| February 2026 | 5 |
| March 2026 | 5 |
| April 2026 | 7 |
| May 2026 | 6 |
| June 2026 | 6 |
| July 2026 | 6 |
| August 2026 | 7 |
| September 2026 | 4 |
Source: Naples Area Board of REALTORS® (NABOR®) MLS, via InfoSparks. Data through September 2026. Data deemed reliable but not guaranteed.
4 as of September 2026, up 5.3% year-over-year.
View monthly data
| Month | Months Supply |
|---|---|
| October 2025 | 3.8 |
| November 2025 | 3 |
| December 2025 | 3 |
| January 2026 | 2.3 |
| February 2026 | 3.8 |
| March 2026 | 4 |
| April 2026 | 5.6 |
| May 2026 | 5 |
| June 2026 | 6 |
| July 2026 | 6 |
| August 2026 | 7 |
| September 2026 | 4 |
Source: Naples Area Board of REALTORS® (NABOR®) MLS, via InfoSparks. Data through September 2026. Data deemed reliable but not guaranteed.
Activity
Monitor real estate transaction volume in The Terraces. Pending and closed sales reflect the pace of buyer demand and overall market momentum.
Pending Sales
3 as of September 2026.
View monthly data
| Month | Pending Sales |
|---|---|
| October 2025 | 0 |
| November 2025 | 0 |
| December 2025 | 0 |
| January 2026 | 0 |
| February 2026 | 0 |
| March 2026 | 1 |
| April 2026 | 1 |
| May 2026 | 1 |
| June 2026 | 0 |
| July 2026 | 0 |
| August 2026 | 0 |
| September 2026 | 3 |
Source: Naples Area Board of REALTORS® (NABOR®) MLS, via InfoSparks. Data through September 2026. Data deemed reliable but not guaranteed.
Total Sales
1 as of September 2026, up 0.0% year-over-year.
View monthly data
| Month | Total Sales |
|---|---|
| October 2025 | 0 |
| November 2025 | 0 |
| December 2025 | 0 |
| January 2026 | 0 |
| February 2026 | 0 |
| March 2026 | 1 |
| April 2026 | 0 |
| May 2026 | 1 |
| June 2026 | 1 |
| July 2026 | 0 |
| August 2026 | 0 |
| September 2026 | 1 |
Source: Naples Area Board of REALTORS® (NABOR®) MLS, via InfoSparks. Data through September 2026. Data deemed reliable but not guaranteed.
Pending Sales
3 as of September 2026.
View monthly data
| Month | Pending Sales |
|---|---|
| October 2025 | 0 |
| November 2025 | 0 |
| December 2025 | 0 |
| January 2026 | 0 |
| February 2026 | 0 |
| March 2026 | 1 |
| April 2026 | 1 |
| May 2026 | 1 |
| June 2026 | 0 |
| July 2026 | 0 |
| August 2026 | 0 |
| September 2026 | 3 |
Source: Naples Area Board of REALTORS® (NABOR®) MLS, via InfoSparks. Data through September 2026. Data deemed reliable but not guaranteed.
1 as of September 2026, up 0.0% year-over-year.
View monthly data
| Month | Total Sales |
|---|---|
| October 2025 | 0 |
| November 2025 | 0 |
| December 2025 | 0 |
| January 2026 | 0 |
| February 2026 | 0 |
| March 2026 | 1 |
| April 2026 | 0 |
| May 2026 | 1 |
| June 2026 | 1 |
| July 2026 | 0 |
| August 2026 | 0 |
| September 2026 | 1 |
Source: Naples Area Board of REALTORS® (NABOR®) MLS, via InfoSparks. Data through September 2026. Data deemed reliable but not guaranteed.
