River Hall Country Club
Gated · ~$300k – $1.5M+
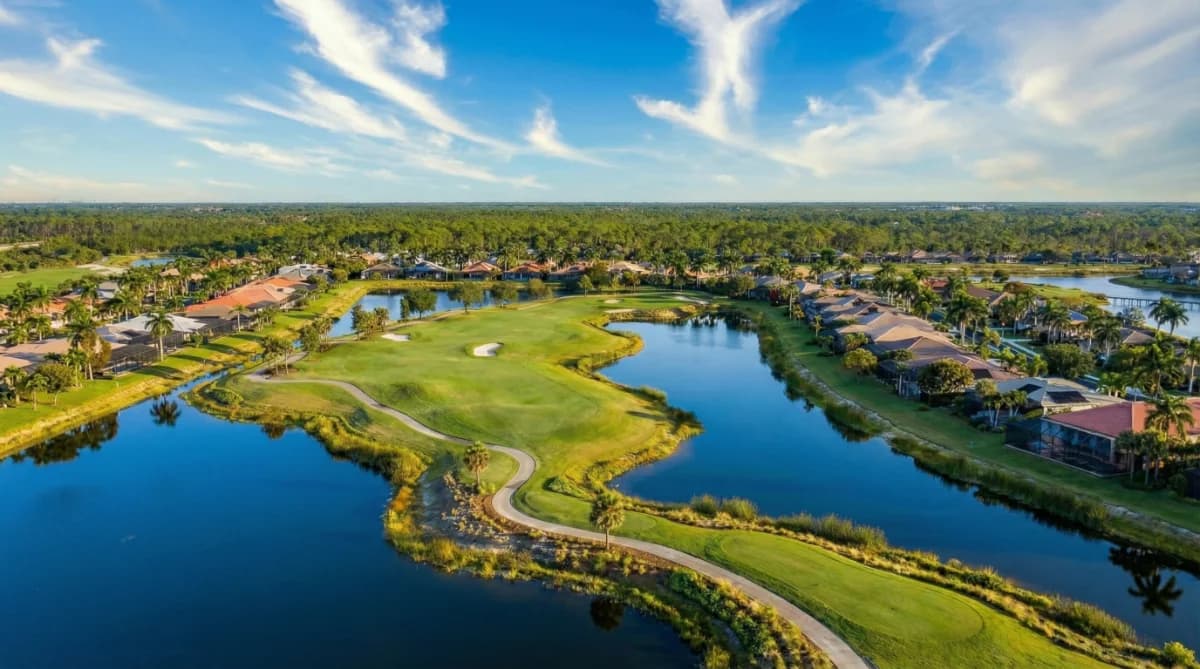
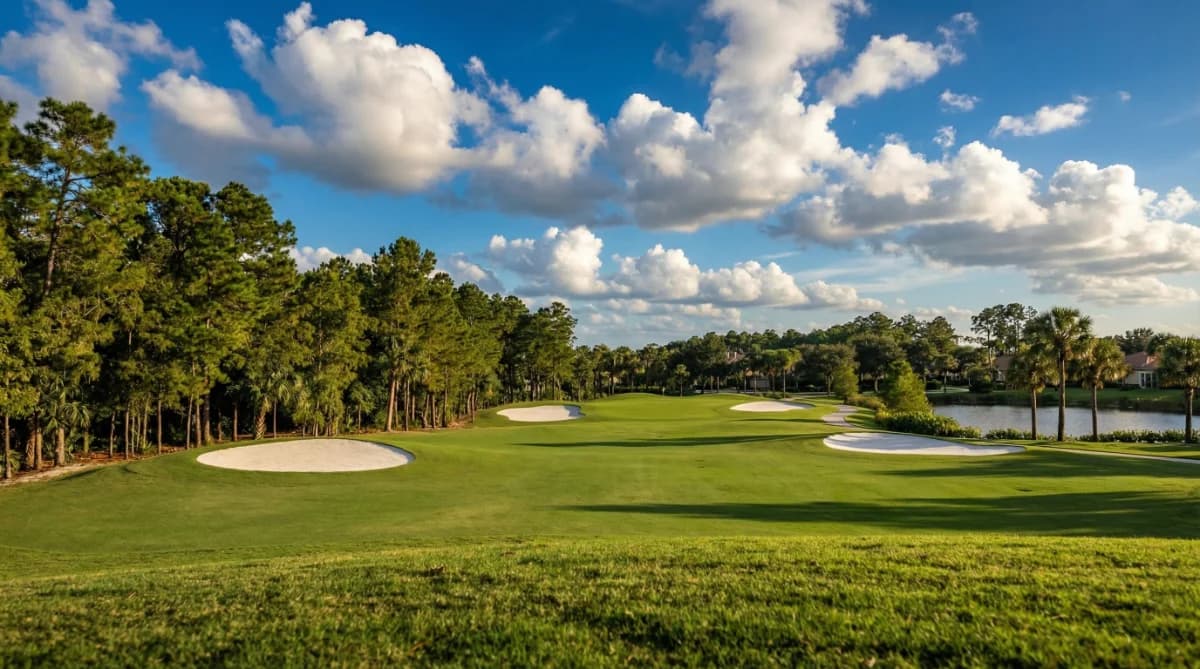
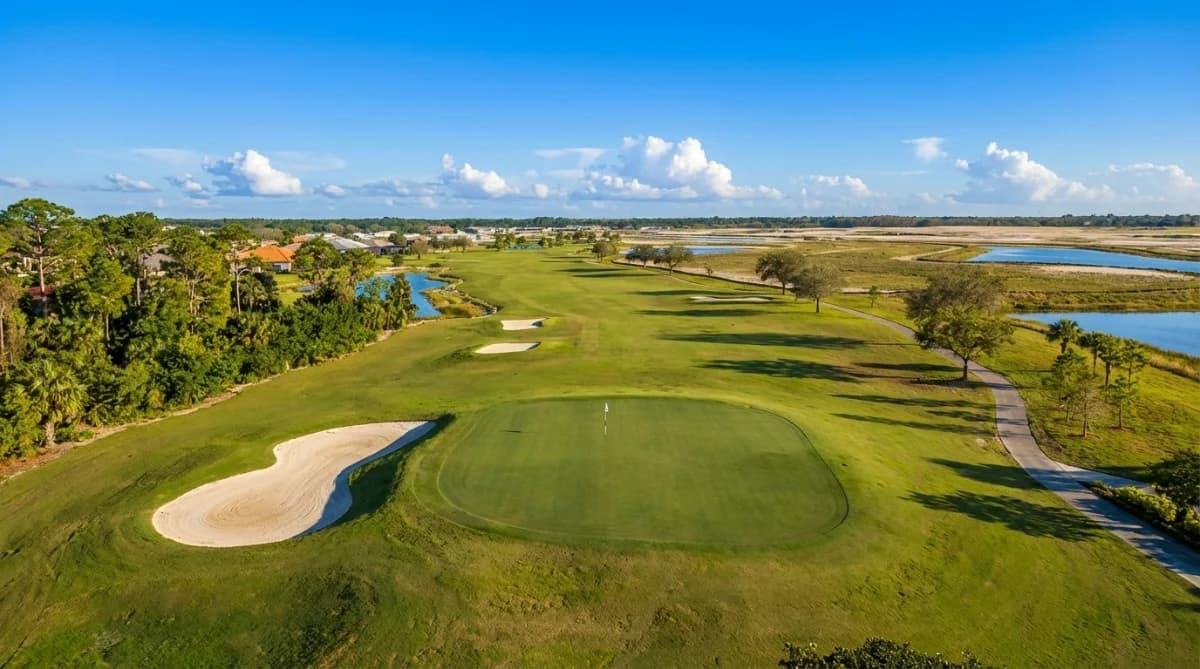
River Hall Country Club is a private golf community east of Fort Myers, Florida. The 18-hole championship course was designed by Davis Love III and features forgiving fairways, multiple tee boxes, and a layout that can challenge experienced golfers or play more relaxed from the forward tees.
Practice facilities include expansive two-way practice areas, bunkers, a short course, and putting greens, giving golfers room to refine every part of their game.
Golf & memberships
River Hall is a master-planned community spread across approximately 1,500 acres. A full golf membership is bundled with most homes in the golf neighborhoods, while subdivisions such as The Cascades (55+) and Hampton Lakes carry a social membership with limited golf privileges.
Amenities & community life
The Town Hall Amenity Center offers a resort-style lagoon pool, lakeside pool and Bunker Bar, fitness center, Har-Tru tennis courts, pickleball, and bocce. The clubhouse and dining venues provide country club dining and social spaces with views over the course.
For buyers seeking a Davis Love III-designed bundled golf community near Fort Myers with strong practice facilities, multiple membership paths, and a full suite of resort-style amenities, River Hall Country Club is an appealing choice.
Quick Facts
- Home Prices
- ~$300k – $1.5M+
- Monthly Fees
- Club golf dues currently ≈$350/mo; total carrying costs vary by subdivision and HOA.
- Initiation Fee
- Bundled with ownership for most golf neighborhoods (Cascades & Hampton Lakes include social membership; other one-time/HOA fees vary by subdivision).
- Community Type
- Bundled golf community, Club membership required
- Gated
- Yes
- Location
- Alva, Florida (east of Fort Myers)
- Established
- 2007
- Lifestyle
- Davis Love III-designed bundled golf community with resort-style pools and court sports
- Golf
- 18-hole, par 72 Davis Love III course with forgiving fairways, multiple tees, and full practice facilities
- Community size
- Approx. 1,500-acre master-planned community
- Memberships
- Up to 885 golf memberships; most homes include golf, while Cascades (55+) and Hampton Lakes include social membership
Properties for Sale
Market Snapshot
The median closed price in River Hall Country Club, North Fort Myers, was $440,000 in September 2026, up 26.6% from $347,500 a year earlier, according to NABOR MLS data through September 2026. This marks a significant increase in median price for all property types, driven entirely by single-family homes, as there were no condo sales in September 2026. The median price per square foot for all property types was $192 in September 2026, also a substantial increase from $176 in September 2025. Pending sales for all property types in River Hall Country Club decreased to 12 in September 2026, compared to 11 in September 2025. This was mainly due to a drop in condo pending sales from 1 in September 2025 to 0 in September 2026, while single-family pending sales saw a slight increase from 10 to 12 over the same period. Total closed sales for all property types increased significantly to 14 in September 2026 from 9 in September 2025. This increase was solely from single-family home sales, which rose from 8 in September 2025 to 14 in September 2026. Inventory in River Hall Country Club saw a slight decrease in September 2026, with 85 homes for sale compared to 93 in September 2025. This was composed of 79 single-family homes and 6 condos on the market in September 2026. The months supply of inventory for all property types decreased to 5.8 months in September 2026, down from 8.9 months in September 2025, indicating a tightening market. For single-family homes, months supply was 6.1 months in September 2026, while for condos, it was 2.4 months.
October 2026 · Last updated Oct 2, 2026
Pricing
Track how home values are trending in River Hall Country Club. Median sale prices and price-per-square-foot data help buyers and sellers gauge current market positioning.
Median Closed Price
$430,000 as of September 2026, up 23.7% year-over-year.
View monthly data
| Month | Median Closed Price |
|---|---|
| October 2025 | $320,000 |
| November 2025 | $345,000 |
| December 2025 | $340,000 |
| January 2026 | $324,549 |
| February 2026 | $339,900 |
| March 2026 | $389,000 |
| April 2026 | $409,000 |
| May 2026 | $390,000 |
| June 2026 | $328,500 |
| July 2026 | $329,000 |
| August 2026 | $346,000 |
| September 2026 | $430,000 |
Source: Naples Area Board of REALTORS® (NABOR®) MLS, via InfoSparks. Data through September 2026. Data deemed reliable but not guaranteed.
Median Prices per Sq ft
$178 as of September 2026, up 1.1% year-over-year.
View monthly data
| Month | Median Prices per Sq ft |
|---|---|
| October 2025 | $195 |
| November 2025 | $180 |
| December 2025 | $184 |
| January 2026 | $172 |
| February 2026 | $184 |
| March 2026 | $193 |
| April 2026 | $182 |
| May 2026 | $162 |
| June 2026 | $184 |
| July 2026 | $157 |
| August 2026 | $175 |
| September 2026 | $178 |
Source: Naples Area Board of REALTORS® (NABOR®) MLS, via InfoSparks. Data through September 2026. Data deemed reliable but not guaranteed.
Median Closed Price
$430,000 as of September 2026, up 23.7% year-over-year.
View monthly data
| Month | Median Closed Price |
|---|---|
| October 2025 | $320,000 |
| November 2025 | $345,000 |
| December 2025 | $340,000 |
| January 2026 | $324,549 |
| February 2026 | $339,900 |
| March 2026 | $389,000 |
| April 2026 | $409,000 |
| May 2026 | $390,000 |
| June 2026 | $328,500 |
| July 2026 | $329,000 |
| August 2026 | $346,000 |
| September 2026 | $430,000 |
Source: Naples Area Board of REALTORS® (NABOR®) MLS, via InfoSparks. Data through September 2026. Data deemed reliable but not guaranteed.
$178 as of September 2026, up 1.1% year-over-year.
View monthly data
| Month | Median Prices per Sq ft |
|---|---|
| October 2025 | $195 |
| November 2025 | $180 |
| December 2025 | $184 |
| January 2026 | $172 |
| February 2026 | $184 |
| March 2026 | $193 |
| April 2026 | $182 |
| May 2026 | $162 |
| June 2026 | $184 |
| July 2026 | $157 |
| August 2026 | $175 |
| September 2026 | $178 |
Source: Naples Area Board of REALTORS® (NABOR®) MLS, via InfoSparks. Data through September 2026. Data deemed reliable but not guaranteed.
Inventory
See how many homes are available in River Hall Country Club and how quickly inventory is moving. Months of supply indicates whether conditions favor buyers or sellers.
Homes For Sale
92 as of September 2026, down 1.1% year-over-year.
View monthly data
| Month | Homes For Sale |
|---|---|
| October 2025 | 105 |
| November 2025 | 111 |
| December 2025 | 96 |
| January 2026 | 97 |
| February 2026 | 105 |
| March 2026 | 88 |
| April 2026 | 99 |
| May 2026 | 99 |
| June 2026 | 97 |
| July 2026 | 96 |
| August 2026 | 90 |
| September 2026 | 92 |
Source: Naples Area Board of REALTORS® (NABOR®) MLS, via InfoSparks. Data through September 2026. Data deemed reliable but not guaranteed.
Months Supply
6.2 as of September 2026, down 30.3% year-over-year.
View monthly data
| Month | Months Supply |
|---|---|
| October 2025 | 9.7 |
| November 2025 | 9.9 |
| December 2025 | 8.7 |
| January 2026 | 8.3 |
| February 2026 | 8.8 |
| March 2026 | 7.2 |
| April 2026 | 7.1 |
| May 2026 | 7.3 |
| June 2026 | 7 |
| July 2026 | 7.1 |
| August 2026 | 6.3 |
| September 2026 | 6.2 |
Source: Naples Area Board of REALTORS® (NABOR®) MLS, via InfoSparks. Data through September 2026. Data deemed reliable but not guaranteed.
Homes For Sale
92 as of September 2026, down 1.1% year-over-year.
View monthly data
| Month | Homes For Sale |
|---|---|
| October 2025 | 105 |
| November 2025 | 111 |
| December 2025 | 96 |
| January 2026 | 97 |
| February 2026 | 105 |
| March 2026 | 88 |
| April 2026 | 99 |
| May 2026 | 99 |
| June 2026 | 97 |
| July 2026 | 96 |
| August 2026 | 90 |
| September 2026 | 92 |
Source: Naples Area Board of REALTORS® (NABOR®) MLS, via InfoSparks. Data through September 2026. Data deemed reliable but not guaranteed.
6.2 as of September 2026, down 30.3% year-over-year.
View monthly data
| Month | Months Supply |
|---|---|
| October 2025 | 9.7 |
| November 2025 | 9.9 |
| December 2025 | 8.7 |
| January 2026 | 8.3 |
| February 2026 | 8.8 |
| March 2026 | 7.2 |
| April 2026 | 7.1 |
| May 2026 | 7.3 |
| June 2026 | 7 |
| July 2026 | 7.1 |
| August 2026 | 6.3 |
| September 2026 | 6.2 |
Source: Naples Area Board of REALTORS® (NABOR®) MLS, via InfoSparks. Data through September 2026. Data deemed reliable but not guaranteed.
Activity
Monitor real estate transaction volume in River Hall Country Club. Pending and closed sales reflect the pace of buyer demand and overall market momentum.
Pending Sales
12 as of September 2026, up 9.1% year-over-year.
View monthly data
| Month | Pending Sales |
|---|---|
| October 2025 | 12 |
| November 2025 | 8 |
| December 2025 | 14 |
| January 2026 | 21 |
| February 2026 | 16 |
| March 2026 | 26 |
| April 2026 | 12 |
| May 2026 | 14 |
| June 2026 | 16 |
| July 2026 | 15 |
| August 2026 | 17 |
| September 2026 | 12 |
Source: Naples Area Board of REALTORS® (NABOR®) MLS, via InfoSparks. Data through September 2026. Data deemed reliable but not guaranteed.
Total Sales
15 as of September 2026, up 66.7% year-over-year.
View monthly data
| Month | Total Sales |
|---|---|
| October 2025 | 8 |
| November 2025 | 14 |
| December 2025 | 7 |
| January 2026 | 18 |
| February 2026 | 15 |
| March 2026 | 13 |
| April 2026 | 33 |
| May 2026 | 9 |
| June 2026 | 16 |
| July 2026 | 11 |
| August 2026 | 18 |
| September 2026 | 15 |
Source: Naples Area Board of REALTORS® (NABOR®) MLS, via InfoSparks. Data through September 2026. Data deemed reliable but not guaranteed.
Pending Sales
12 as of September 2026, up 9.1% year-over-year.
View monthly data
| Month | Pending Sales |
|---|---|
| October 2025 | 12 |
| November 2025 | 8 |
| December 2025 | 14 |
| January 2026 | 21 |
| February 2026 | 16 |
| March 2026 | 26 |
| April 2026 | 12 |
| May 2026 | 14 |
| June 2026 | 16 |
| July 2026 | 15 |
| August 2026 | 17 |
| September 2026 | 12 |
Source: Naples Area Board of REALTORS® (NABOR®) MLS, via InfoSparks. Data through September 2026. Data deemed reliable but not guaranteed.
15 as of September 2026, up 66.7% year-over-year.
View monthly data
| Month | Total Sales |
|---|---|
| October 2025 | 8 |
| November 2025 | 14 |
| December 2025 | 7 |
| January 2026 | 18 |
| February 2026 | 15 |
| March 2026 | 13 |
| April 2026 | 33 |
| May 2026 | 9 |
| June 2026 | 16 |
| July 2026 | 11 |
| August 2026 | 18 |
| September 2026 | 15 |
Source: Naples Area Board of REALTORS® (NABOR®) MLS, via InfoSparks. Data through September 2026. Data deemed reliable but not guaranteed.