 community
Ave Maria • Ave Maria Fl
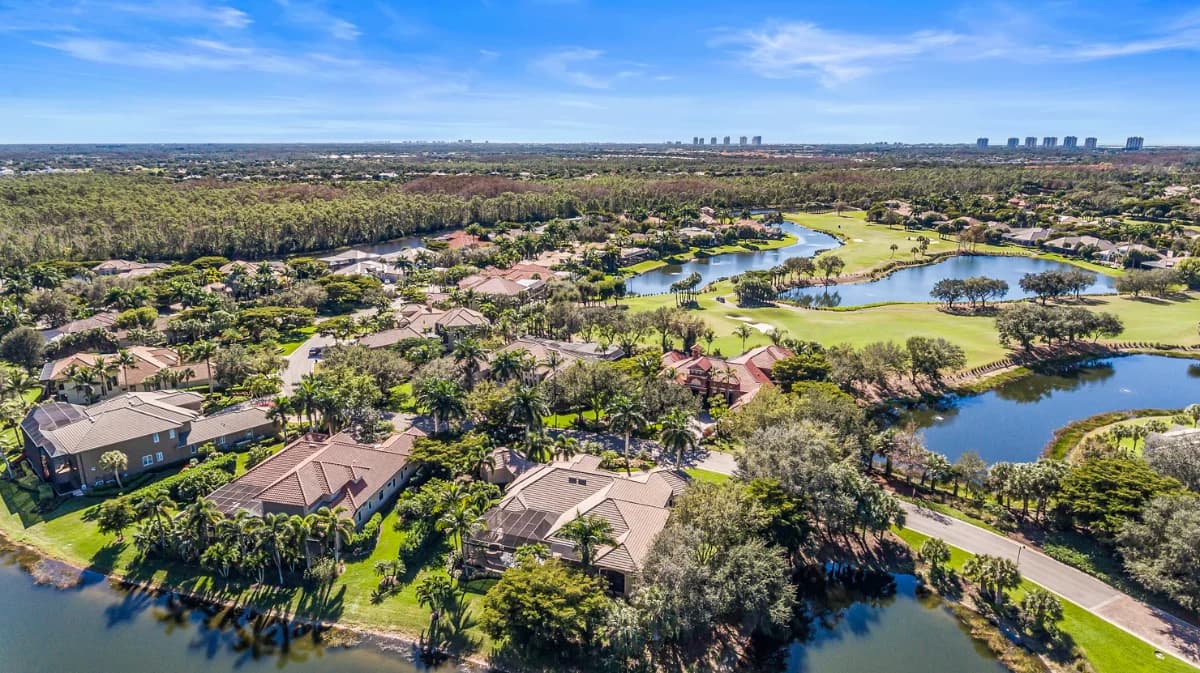
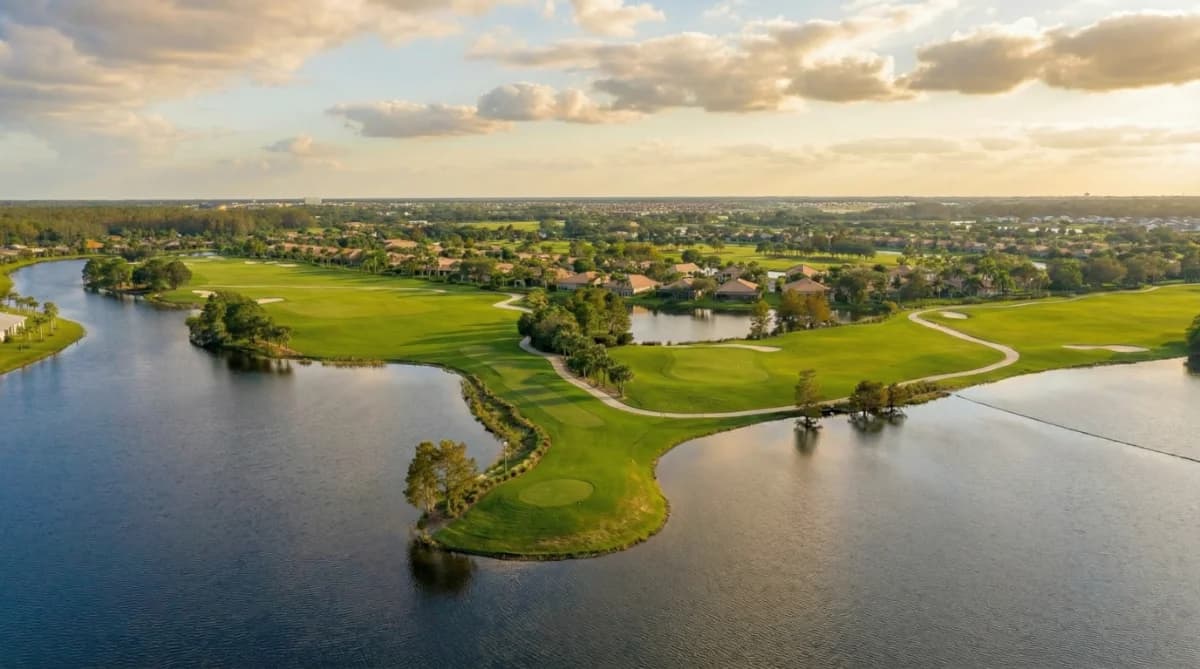
The National Golf & Country Club at Ave Maria
Newest bundled golf community at Ave Maria with a Gordon Lewis course, resort-style amenities, and a mix of golf and social memberships.
~$250k – $1.1M+
Ave Maria is a master-planned community located east of Naples, recognized for its structured design, growing residential base, and strong sense of community. The town continues to expand with a focus on long-term development.
Centered around a walkable town core, Ave Maria features parks, dining, retail, and recreational amenities integrated throughout its neighborhoods. The presence of Ave Maria University contributes to the area’s identity and activity.
While removed from the coast, Ave Maria offers a more self-contained lifestyle with a quieter pace. It appeals to those seeking newer construction and a community-oriented environment within Southwest Florida.
Here's the latest snapshot of the Ave Maria real estate market, reflecting data up to April 2026. The median sales price in Ave Maria stood at $460,000 in April 2026. Recent fluctuations show a dip to $354,000 in March 2026 before recovering. Looking back further, the median sales price has varied over the past year, with a high of $505,000 in February 2026 and a low of $393,390 in November 2025. Inventory levels in Ave Maria continue to show an upward trend. The number of homes for sale reached 191 in April 2026, slightly down from 194 in March 2026. The months' supply of homes for sale was 11.1 in April 2026, indicating a continued increase in available inventory compared to earlier periods. In comparison, January 2023 had only 70 homes for sale, and the months' supply was 5.3. Sales activity in Ave Maria shows 23 total sales closed in April 2026, alongside 20 pending sales. This is up from 11 sales in February 2026.. The median price per square foot was $220 in April 2026, consistent with the $225 seen in both February and March 2026.
May 2026 · Last updated May 1, 2026
Track how home values are trending in Ave Maria. Median sale prices and price-per-square-foot data help buyers and sellers gauge current market positioning.
Median Closed Price
$422,500 as of June 2026, up 2.6% year-over-year.
| Month | Median Closed Price |
|---|---|
| July 2025 | $418,000 |
| August 2025 | $415,000 |
| September 2025 | $399,259 |
| October 2025 | $417,500 |
| November 2025 | $393,390 |
| December 2025 | $425,000 |
| January 2026 | $415,000 |
| February 2026 | $505,000 |
| March 2026 | $354,000 |
| April 2026 | $460,000 |
| May 2026 | $492,500 |
| June 2026 | $422,500 |
Source: Naples Area Board of REALTORS® (NABOR®) MLS, via InfoSparks. Data through June 2026. Data deemed reliable but not guaranteed.
Median Prices per Sq ft
$216 as of June 2026, down 4.0% year-over-year.
| Month | Median Prices per Sq ft |
|---|---|
| July 2025 | $232 |
| August 2025 | $224 |
| September 2025 | $229 |
| October 2025 | $212 |
| November 2025 | $228 |
| December 2025 | $226 |
| January 2026 | $228 |
| February 2026 | $225 |
| March 2026 | $225 |
| April 2026 | $220 |
| May 2026 | $211 |
| June 2026 | $216 |
Source: Naples Area Board of REALTORS® (NABOR®) MLS, via InfoSparks. Data through June 2026. Data deemed reliable but not guaranteed.
Median Closed Price
$422,500 as of June 2026, up 2.6% year-over-year.
| Month | Median Closed Price |
|---|---|
| July 2025 | $418,000 |
| August 2025 | $415,000 |
| September 2025 | $399,259 |
| October 2025 | $417,500 |
| November 2025 | $393,390 |
| December 2025 | $425,000 |
| January 2026 | $415,000 |
| February 2026 | $505,000 |
| March 2026 | $354,000 |
| April 2026 | $460,000 |
| May 2026 | $492,500 |
| June 2026 | $422,500 |
Source: Naples Area Board of REALTORS® (NABOR®) MLS, via InfoSparks. Data through June 2026. Data deemed reliable but not guaranteed.
$216 as of June 2026, down 4.0% year-over-year.
| Month | Median Prices per Sq ft |
|---|---|
| July 2025 | $232 |
| August 2025 | $224 |
| September 2025 | $229 |
| October 2025 | $212 |
| November 2025 | $228 |
| December 2025 | $226 |
| January 2026 | $228 |
| February 2026 | $225 |
| March 2026 | $225 |
| April 2026 | $220 |
| May 2026 | $211 |
| June 2026 | $216 |
Source: Naples Area Board of REALTORS® (NABOR®) MLS, via InfoSparks. Data through June 2026. Data deemed reliable but not guaranteed.
See how many homes are available in Ave Maria and how quickly inventory is moving. Months of supply indicates whether conditions favor buyers or sellers.
Homes For Sale
184 as of May 2026, up 13.6% year-over-year.
| Month | Homes For Sale |
|---|---|
| June 2025 | 159 |
| July 2025 | 155 |
| August 2025 | 161 |
| September 2025 | 157 |
| October 2025 | 156 |
| November 2025 | 160 |
| December 2025 | 153 |
| January 2026 | 183 |
| February 2026 | 187 |
| March 2026 | 194 |
| April 2026 | 197 |
| May 2026 | 184 |
Source: Naples Area Board of REALTORS® (NABOR®) MLS, via InfoSparks. Data through May 2026. Data deemed reliable but not guaranteed.
Months Supply
10.9 as of June 2026, up 2.8% year-over-year.
| Month | Months Supply |
|---|---|
| July 2025 | 10.3 |
| August 2025 | 10.3 |
| September 2025 | 9.8 |
| October 2025 | 9.5 |
| November 2025 | 9.6 |
| December 2025 | 9.3 |
| January 2026 | 10.8 |
| February 2026 | 11.2 |
| March 2026 | 11.8 |
| April 2026 | 11.7 |
| May 2026 | 10.8 |
| June 2026 | 10.9 |
Source: Naples Area Board of REALTORS® (NABOR®) MLS, via InfoSparks. Data through June 2026. Data deemed reliable but not guaranteed.
Homes For Sale
184 as of May 2026, up 13.6% year-over-year.
| Month | Homes For Sale |
|---|---|
| June 2025 | 159 |
| July 2025 | 155 |
| August 2025 | 161 |
| September 2025 | 157 |
| October 2025 | 156 |
| November 2025 | 160 |
| December 2025 | 153 |
| January 2026 | 183 |
| February 2026 | 187 |
| March 2026 | 194 |
| April 2026 | 197 |
| May 2026 | 184 |
Source: Naples Area Board of REALTORS® (NABOR®) MLS, via InfoSparks. Data through May 2026. Data deemed reliable but not guaranteed.
10.9 as of June 2026, up 2.8% year-over-year.
| Month | Months Supply |
|---|---|
| July 2025 | 10.3 |
| August 2025 | 10.3 |
| September 2025 | 9.8 |
| October 2025 | 9.5 |
| November 2025 | 9.6 |
| December 2025 | 9.3 |
| January 2026 | 10.8 |
| February 2026 | 11.2 |
| March 2026 | 11.8 |
| April 2026 | 11.7 |
| May 2026 | 10.8 |
| June 2026 | 10.9 |
Source: Naples Area Board of REALTORS® (NABOR®) MLS, via InfoSparks. Data through June 2026. Data deemed reliable but not guaranteed.
Monitor real estate transaction volume in Ave Maria. Pending and closed sales reflect the pace of buyer demand and overall market momentum.
Pending Sales
19 as of June 2026, down 5.0% year-over-year.
| Month | Pending Sales |
|---|---|
| July 2025 | 20 |
| August 2025 | 15 |
| September 2025 | 18 |
| October 2025 | 17 |
| November 2025 | 13 |
| December 2025 | 10 |
| January 2026 | 15 |
| February 2026 | 20 |
| March 2026 | 25 |
| April 2026 | 18 |
| May 2026 | 16 |
| June 2026 | 19 |
Source: Naples Area Board of REALTORS® (NABOR®) MLS, via InfoSparks. Data through June 2026. Data deemed reliable but not guaranteed.
Total Sales
18 as of June 2026, up 0.0% year-over-year.
| Month | Total Sales |
|---|---|
| July 2025 | 16 |
| August 2025 | 19 |
| September 2025 | 18 |
| October 2025 | 14 |
| November 2025 | 15 |
| December 2025 | 15 |
| January 2026 | 17 |
| February 2026 | 11 |
| March 2026 | 20 |
| April 2026 | 23 |
| May 2026 | 22 |
| June 2026 | 18 |
Source: Naples Area Board of REALTORS® (NABOR®) MLS, via InfoSparks. Data through June 2026. Data deemed reliable but not guaranteed.
Pending Sales
19 as of June 2026, down 5.0% year-over-year.
| Month | Pending Sales |
|---|---|
| July 2025 | 20 |
| August 2025 | 15 |
| September 2025 | 18 |
| October 2025 | 17 |
| November 2025 | 13 |
| December 2025 | 10 |
| January 2026 | 15 |
| February 2026 | 20 |
| March 2026 | 25 |
| April 2026 | 18 |
| May 2026 | 16 |
| June 2026 | 19 |
Source: Naples Area Board of REALTORS® (NABOR®) MLS, via InfoSparks. Data through June 2026. Data deemed reliable but not guaranteed.
18 as of June 2026, up 0.0% year-over-year.
| Month | Total Sales |
|---|---|
| July 2025 | 16 |
| August 2025 | 19 |
| September 2025 | 18 |
| October 2025 | 14 |
| November 2025 | 15 |
| December 2025 | 15 |
| January 2026 | 17 |
| February 2026 | 11 |
| March 2026 | 20 |
| April 2026 | 23 |
| May 2026 | 22 |
| June 2026 | 18 |
Source: Naples Area Board of REALTORS® (NABOR®) MLS, via InfoSparks. Data through June 2026. Data deemed reliable but not guaranteed.
communityNewest bundled golf community at Ave Maria with a Gordon Lewis course, resort-style amenities, and a mix of golf and social memberships.
 community
55+ golf community in Ave Maria with a Gordon Lewis championship course, resort-style amenities, and an active Del Webb lifestyle.