 area
area
Aqualane Shores
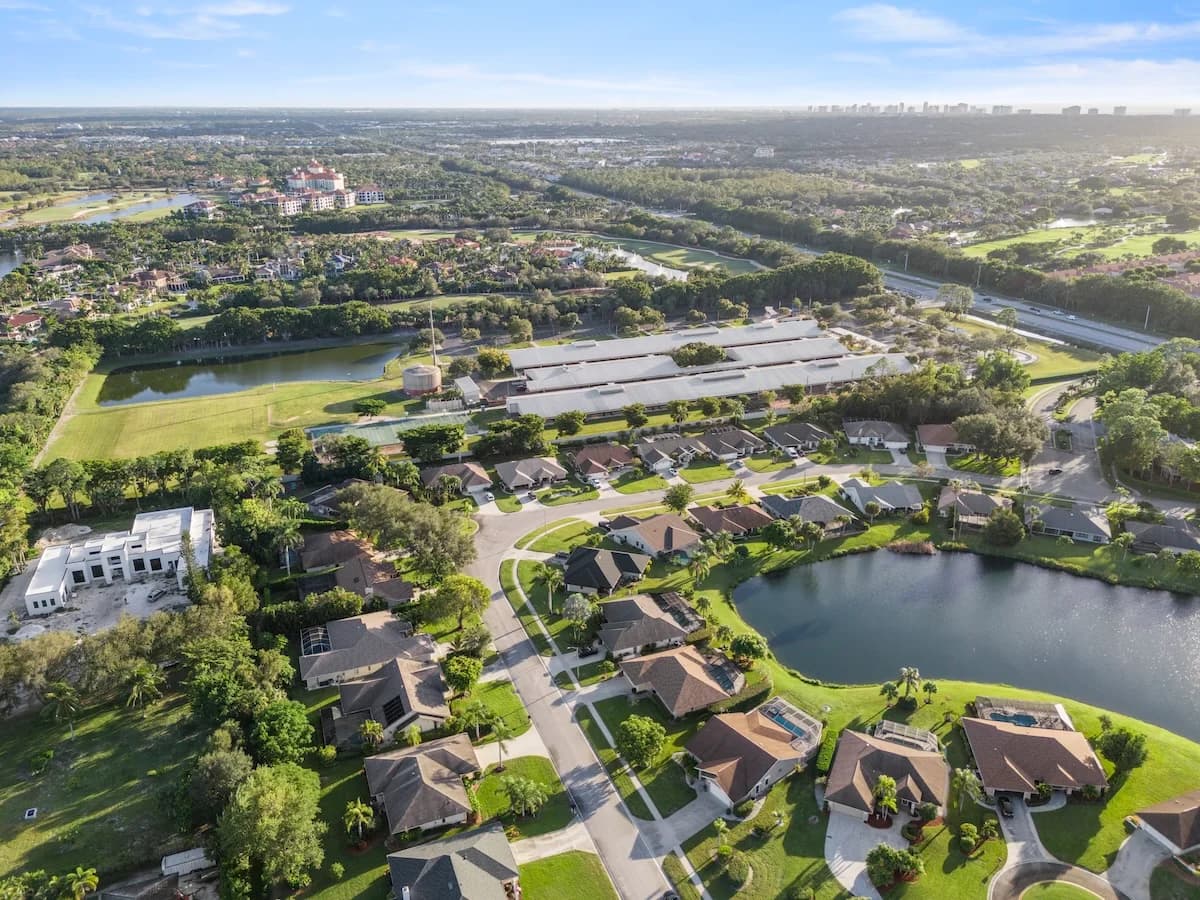
Aqualane Shores is a premier waterfront community in Naples, positioned between Olde Naples and Port Royal. Known for its direct Gulf access, wide canals, and walkable streets, the neighborhood offers a refined coastal setting with a strong emphasis on boating and proximity to the beach.
Waterfront Living & Boating
With deep-water canals and no bridge access to the Gulf, Aqualane Shores is particularly well-suited for boating enthusiasts. Many homes feature private docks, allowing for immediate access to Naples Bay and the Gulf beyond. The neighborhood’s layout prioritizes both water views and ease of navigation.
Location & Lifestyle
Residents enjoy the ability to walk or bike to Third Street South and Fifth Avenue South, where dining, shopping, and local events are part of everyday life. The combination of waterfront access and walkability creates a lifestyle that feels both connected and quietly exclusive.
Properties for Sale
Market Snapshot
Here's a snapshot of the Aqualane Shores, Naples real estate market as of May 1, 2026. The median sales price in April 2026 was $13,600,000. Recent median sales prices in Aqualane Shores have fluctuated, with February 2026 at $12,237,500 and March 2026 at $10,350,000. The median price per square foot in April 2026 was $2,084, down from February 2026 when it was $2,439. The inventory of homes for sale in Aqualane Shores remains relatively steady. In April 2026, there were 38 homes for sale, a slight decrease from the 41 homes available in February 2026. Looking back further, inventory levels have generally ranged from the mid-20s to the high 40s over the past year and a half. Sales activity in Aqualane Shores shows 4 homes sold in April 2026, down from 5 in March 2026. Pending sales also decreased to 1 in April 2026, from 5 the prior month. The months' supply of homes for sale was 14.7 in April 2026, a decrease from 17.6 in February 2026, but generally consistent with levels seen throughout 2025 and 2026.
May 2026 · Last updated May 1, 2026
Pricing
Track how home values are trending in Aqualane Shores. Median sale prices and price-per-square-foot data help buyers and sellers gauge current market positioning.
Median Closed Price
$9,750,000 as of May 2026, up 191.0% year-over-year.
View monthly data
| Month | Median Closed Price |
|---|---|
| June 2025 | $13,000,000 |
| July 2025 | $5,250,000 |
| August 2025 | $4,050,000 |
| September 2025 | $15,250,000 |
| October 2025 | $4,500,000 |
| November 2025 | $11,125,000 |
| December 2025 | $8,400,000 |
| January 2026 | $12,000,000 |
| February 2026 | $12,237,500 |
| March 2026 | $10,350,000 |
| April 2026 | $13,600,000 |
| May 2026 | $9,750,000 |
Source: Naples Area Board of REALTORS® (NABOR®) MLS, via InfoSparks. Data through May 2026. Data deemed reliable but not guaranteed.
Median Prices per Sq ft
$1,253 as of May 2026, down 0.1% year-over-year.
View monthly data
| Month | Median Prices per Sq ft |
|---|---|
| June 2025 | $2,371 |
| July 2025 | $1,087 |
| August 2025 | $1,292 |
| September 2025 | $2,310 |
| October 2025 | $1,616 |
| November 2025 | $2,048 |
| December 2025 | $3,579 |
| January 2026 | $2,269 |
| February 2026 | $2,439 |
| March 2026 | $1,791 |
| April 2026 | $2,084 |
| May 2026 | $1,253 |
Source: Naples Area Board of REALTORS® (NABOR®) MLS, via InfoSparks. Data through May 2026. Data deemed reliable but not guaranteed.
Median Closed Price
$9,750,000 as of May 2026, up 191.0% year-over-year.
View monthly data
| Month | Median Closed Price |
|---|---|
| June 2025 | $13,000,000 |
| July 2025 | $5,250,000 |
| August 2025 | $4,050,000 |
| September 2025 | $15,250,000 |
| October 2025 | $4,500,000 |
| November 2025 | $11,125,000 |
| December 2025 | $8,400,000 |
| January 2026 | $12,000,000 |
| February 2026 | $12,237,500 |
| March 2026 | $10,350,000 |
| April 2026 | $13,600,000 |
| May 2026 | $9,750,000 |
Source: Naples Area Board of REALTORS® (NABOR®) MLS, via InfoSparks. Data through May 2026. Data deemed reliable but not guaranteed.
$1,253 as of May 2026, down 0.1% year-over-year.
View monthly data
| Month | Median Prices per Sq ft |
|---|---|
| June 2025 | $2,371 |
| July 2025 | $1,087 |
| August 2025 | $1,292 |
| September 2025 | $2,310 |
| October 2025 | $1,616 |
| November 2025 | $2,048 |
| December 2025 | $3,579 |
| January 2026 | $2,269 |
| February 2026 | $2,439 |
| March 2026 | $1,791 |
| April 2026 | $2,084 |
| May 2026 | $1,253 |
Source: Naples Area Board of REALTORS® (NABOR®) MLS, via InfoSparks. Data through May 2026. Data deemed reliable but not guaranteed.
Inventory
See how many homes are available in Aqualane Shores and how quickly inventory is moving. Months of supply indicates whether conditions favor buyers or sellers.
Homes For Sale
28 as of June 2026, down 20.0% year-over-year.
View monthly data
| Month | Homes For Sale |
|---|---|
| July 2025 | 31 |
| August 2025 | 26 |
| September 2025 | 27 |
| October 2025 | 27 |
| November 2025 | 34 |
| December 2025 | 36 |
| January 2026 | 43 |
| February 2026 | 42 |
| March 2026 | 40 |
| April 2026 | 39 |
| May 2026 | 35 |
| June 2026 | 28 |
Source: Naples Area Board of REALTORS® (NABOR®) MLS, via InfoSparks. Data through June 2026. Data deemed reliable but not guaranteed.
Months Supply
14 as of June 2026, up 11.1% year-over-year.
View monthly data
| Month | Months Supply |
|---|---|
| July 2025 | 10.3 |
| August 2025 | 9 |
| September 2025 | 9.9 |
| October 2025 | 10.5 |
| November 2025 | 12.4 |
| December 2025 | 13.5 |
| January 2026 | 17.2 |
| February 2026 | 18 |
| March 2026 | 16.6 |
| April 2026 | 15.1 |
| May 2026 | 14 |
| June 2026 | 14 |
Source: Naples Area Board of REALTORS® (NABOR®) MLS, via InfoSparks. Data through June 2026. Data deemed reliable but not guaranteed.
Homes For Sale
28 as of June 2026, down 20.0% year-over-year.
View monthly data
| Month | Homes For Sale |
|---|---|
| July 2025 | 31 |
| August 2025 | 26 |
| September 2025 | 27 |
| October 2025 | 27 |
| November 2025 | 34 |
| December 2025 | 36 |
| January 2026 | 43 |
| February 2026 | 42 |
| March 2026 | 40 |
| April 2026 | 39 |
| May 2026 | 35 |
| June 2026 | 28 |
Source: Naples Area Board of REALTORS® (NABOR®) MLS, via InfoSparks. Data through June 2026. Data deemed reliable but not guaranteed.
14 as of June 2026, up 11.1% year-over-year.
View monthly data
| Month | Months Supply |
|---|---|
| July 2025 | 10.3 |
| August 2025 | 9 |
| September 2025 | 9.9 |
| October 2025 | 10.5 |
| November 2025 | 12.4 |
| December 2025 | 13.5 |
| January 2026 | 17.2 |
| February 2026 | 18 |
| March 2026 | 16.6 |
| April 2026 | 15.1 |
| May 2026 | 14 |
| June 2026 | 14 |
Source: Naples Area Board of REALTORS® (NABOR®) MLS, via InfoSparks. Data through June 2026. Data deemed reliable but not guaranteed.
Activity
Monitor real estate transaction volume in Aqualane Shores. Pending and closed sales reflect the pace of buyer demand and overall market momentum.
Pending Sales
4 as of June 2026, down 20.0% year-over-year.
View monthly data
| Month | Pending Sales |
|---|---|
| July 2025 | 2 |
| August 2025 | 1 |
| September 2025 | 1 |
| October 2025 | 0 |
| November 2025 | 1 |
| December 2025 | 2 |
| January 2026 | 1 |
| February 2026 | 3 |
| March 2026 | 5 |
| April 2026 | 1 |
| May 2026 | 3 |
| June 2026 | 4 |
Source: Naples Area Board of REALTORS® (NABOR®) MLS, via InfoSparks. Data through June 2026. Data deemed reliable but not guaranteed.
Total Sales
1 as of June 2026, down 85.7% year-over-year.
View monthly data
| Month | Total Sales |
|---|---|
| July 2025 | 3 |
| August 2025 | 2 |
| September 2025 | 1 |
| October 2025 | 1 |
| November 2025 | 2 |
| December 2025 | 1 |
| January 2026 | 1 |
| February 2026 | 2 |
| March 2026 | 5 |
| April 2026 | 4 |
| May 2026 | 1 |
| June 2026 | 1 |
Source: Naples Area Board of REALTORS® (NABOR®) MLS, via InfoSparks. Data through June 2026. Data deemed reliable but not guaranteed.
Pending Sales
4 as of June 2026, down 20.0% year-over-year.
View monthly data
| Month | Pending Sales |
|---|---|
| July 2025 | 2 |
| August 2025 | 1 |
| September 2025 | 1 |
| October 2025 | 0 |
| November 2025 | 1 |
| December 2025 | 2 |
| January 2026 | 1 |
| February 2026 | 3 |
| March 2026 | 5 |
| April 2026 | 1 |
| May 2026 | 3 |
| June 2026 | 4 |
Source: Naples Area Board of REALTORS® (NABOR®) MLS, via InfoSparks. Data through June 2026. Data deemed reliable but not guaranteed.
1 as of June 2026, down 85.7% year-over-year.
View monthly data
| Month | Total Sales |
|---|---|
| July 2025 | 3 |
| August 2025 | 2 |
| September 2025 | 1 |
| October 2025 | 1 |
| November 2025 | 2 |
| December 2025 | 1 |
| January 2026 | 1 |
| February 2026 | 2 |
| March 2026 | 5 |
| April 2026 | 4 |
| May 2026 | 1 |
| June 2026 | 1 |
Source: Naples Area Board of REALTORS® (NABOR®) MLS, via InfoSparks. Data through June 2026. Data deemed reliable but not guaranteed.