 Bundled Golf
Naples • East Naples
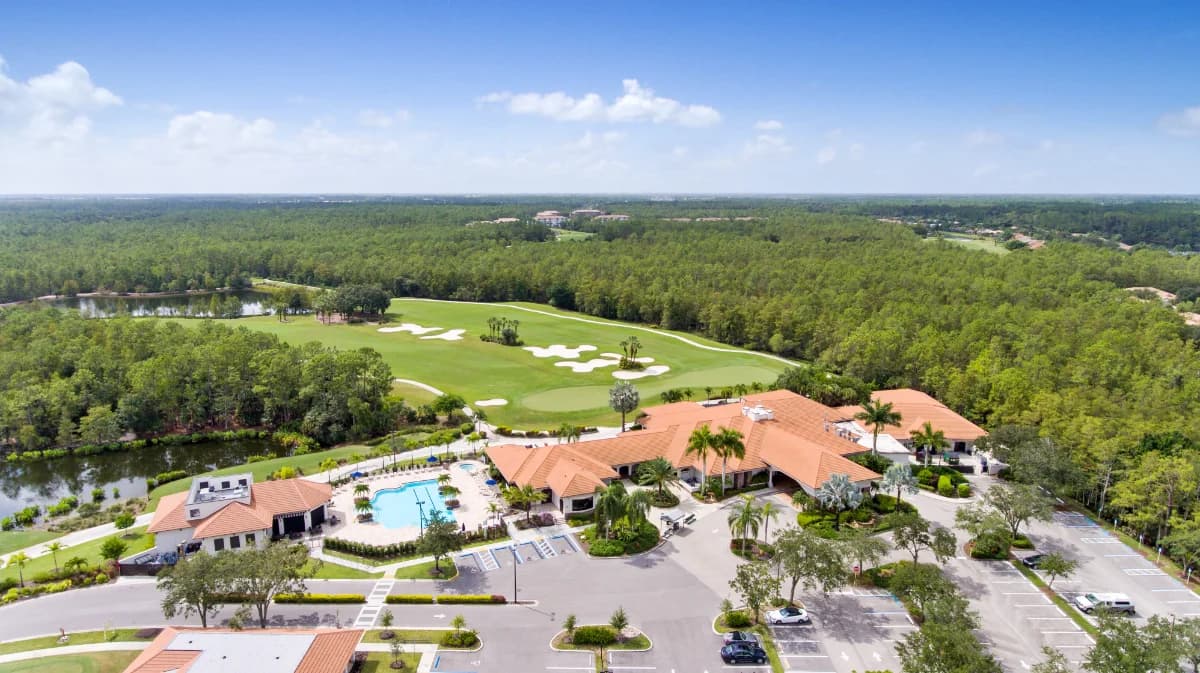
Foxfire Country Club
Gated bundled golf community in Naples with 27 holes of Arthur Hills–designed golf and resort-style amenities close to downtown and the beaches.
Gated~$225k – $1.2M+
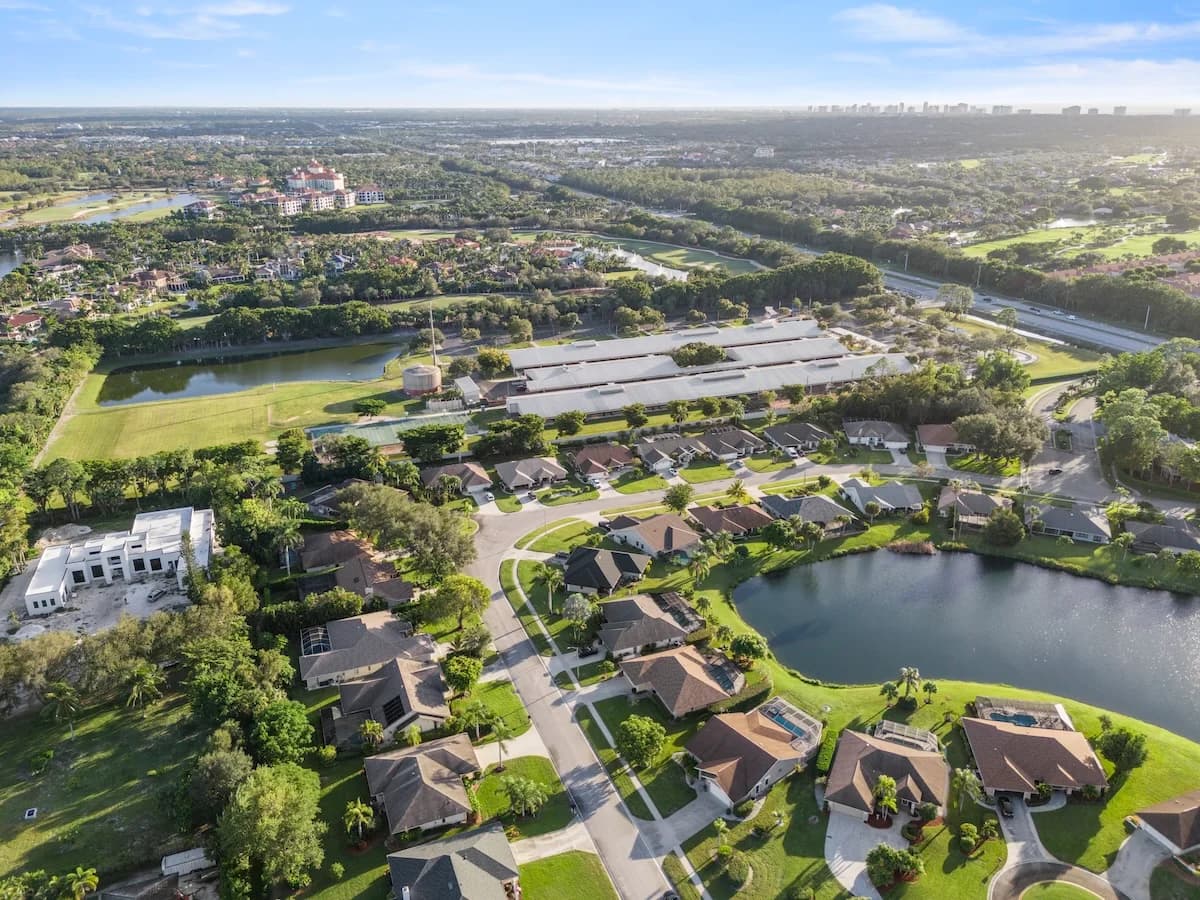
East Naples is a growing area known for its accessibility, diverse housing options, and proximity to both downtown Naples and major roadways. The area has seen steady development over time, offering a mix of established neighborhoods and newer residential communities.
With convenient access to US-41 and Interstate 75, East Naples allows for efficient travel throughout Southwest Florida. The area continues to attract interest due to its relative value, with a range of single-family homes, condominiums, and gated communities available.
Residents are just a short drive from Fifth Avenue South, local beaches, and everyday conveniences. East Naples supports a lifestyle that balances practicality with access to the broader Naples experience, making it a consistent choice for both full-time and seasonal residents.
The East Naples real estate market in April 2026 shows a median sales price of $575,000 for all property types. Broken down, single-family homes had a median sales price of $690,000, while condos were at $440,000. Inventory levels in East Naples remain elevated. As of April 2026, there were 1,300 homes for sale, including 932 single-family homes and 368 condos. The months supply of homes for sale is at 7.2 for all property types. This breaks down to 7.0 months of supply for single-family homes and 7.8 months for condos. Sales activity in East Naples is robust. Total sales in April 2026 reached 223 properties, with 150 single-family homes and 73 condos sold. Pending sales also reflect continued buyer interest, with 253 properties under contract, comprising 193 single-family homes and 60 condos. The median price per square foot for East Naples properties in April 2026 was $312 for all property types. Single-family homes commanded $350 per square foot, while condos were at $266.
May 2026 · Last updated May 1, 2026
Track how home values are trending in East Naples. Median sale prices and price-per-square-foot data help buyers and sellers gauge current market positioning.
Median Closed Price
$578,450 as of June 2026, up 5.2% year-over-year.
| Month | Median Closed Price |
|---|---|
| July 2025 | $620,000 |
| August 2025 | $605,000 |
| September 2025 | $540,000 |
| October 2025 | $565,900 |
| November 2025 | $557,500 |
| December 2025 | $553,950 |
| January 2026 | $575,000 |
| February 2026 | $575,000 |
| March 2026 | $550,000 |
| April 2026 | $570,000 |
| May 2026 | $600,000 |
| June 2026 | $578,450 |
Source: Naples Area Board of REALTORS® (NABOR®) MLS, via InfoSparks. Data through June 2026. Data deemed reliable but not guaranteed.
Median Prices per Sq ft
$316 as of June 2026, down 1.9% year-over-year.
| Month | Median Prices per Sq ft |
|---|---|
| July 2025 | $318 |
| August 2025 | $318 |
| September 2025 | $303 |
| October 2025 | $309 |
| November 2025 | $310 |
| December 2025 | $314 |
| January 2026 | $305 |
| February 2026 | $309 |
| March 2026 | $306 |
| April 2026 | $312 |
| May 2026 | $317 |
| June 2026 | $316 |
Source: Naples Area Board of REALTORS® (NABOR®) MLS, via InfoSparks. Data through June 2026. Data deemed reliable but not guaranteed.
Median Closed Price
$578,450 as of June 2026, up 5.2% year-over-year.
| Month | Median Closed Price |
|---|---|
| July 2025 | $620,000 |
| August 2025 | $605,000 |
| September 2025 | $540,000 |
| October 2025 | $565,900 |
| November 2025 | $557,500 |
| December 2025 | $553,950 |
| January 2026 | $575,000 |
| February 2026 | $575,000 |
| March 2026 | $550,000 |
| April 2026 | $570,000 |
| May 2026 | $600,000 |
| June 2026 | $578,450 |
Source: Naples Area Board of REALTORS® (NABOR®) MLS, via InfoSparks. Data through June 2026. Data deemed reliable but not guaranteed.
$316 as of June 2026, down 1.9% year-over-year.
| Month | Median Prices per Sq ft |
|---|---|
| July 2025 | $318 |
| August 2025 | $318 |
| September 2025 | $303 |
| October 2025 | $309 |
| November 2025 | $310 |
| December 2025 | $314 |
| January 2026 | $305 |
| February 2026 | $309 |
| March 2026 | $306 |
| April 2026 | $312 |
| May 2026 | $317 |
| June 2026 | $316 |
Source: Naples Area Board of REALTORS® (NABOR®) MLS, via InfoSparks. Data through June 2026. Data deemed reliable but not guaranteed.
See how many homes are available in East Naples and how quickly inventory is moving. Months of supply indicates whether conditions favor buyers or sellers.
Homes For Sale
1,121 as of June 2026, down 20.7% year-over-year.
| Month | Homes For Sale |
|---|---|
| July 2025 | 1,305 |
| August 2025 | 1,273 |
| September 2025 | 1,235 |
| October 2025 | 1,312 |
| November 2025 | 1,404 |
| December 2025 | 1,378 |
| January 2026 | 1,473 |
| February 2026 | 1,466 |
| March 2026 | 1,411 |
| April 2026 | 1,338 |
| May 2026 | 1,244 |
| June 2026 | 1,121 |
Source: Naples Area Board of REALTORS® (NABOR®) MLS, via InfoSparks. Data through June 2026. Data deemed reliable but not guaranteed.
Months Supply
6.5 as of May 2026, down 30.9% year-over-year.
| Month | Months Supply |
|---|---|
| June 2025 | 8.8 |
| July 2025 | 8.2 |
| August 2025 | 7.9 |
| September 2025 | 7.7 |
| October 2025 | 7.9 |
| November 2025 | 8.5 |
| December 2025 | 8.1 |
| January 2026 | 8.8 |
| February 2026 | 8.5 |
| March 2026 | 7.8 |
| April 2026 | 7.3 |
| May 2026 | 6.5 |
Source: Naples Area Board of REALTORS® (NABOR®) MLS, via InfoSparks. Data through May 2026. Data deemed reliable but not guaranteed.
Homes For Sale
1,121 as of June 2026, down 20.7% year-over-year.
| Month | Homes For Sale |
|---|---|
| July 2025 | 1,305 |
| August 2025 | 1,273 |
| September 2025 | 1,235 |
| October 2025 | 1,312 |
| November 2025 | 1,404 |
| December 2025 | 1,378 |
| January 2026 | 1,473 |
| February 2026 | 1,466 |
| March 2026 | 1,411 |
| April 2026 | 1,338 |
| May 2026 | 1,244 |
| June 2026 | 1,121 |
Source: Naples Area Board of REALTORS® (NABOR®) MLS, via InfoSparks. Data through June 2026. Data deemed reliable but not guaranteed.
6.5 as of May 2026, down 30.9% year-over-year.
| Month | Months Supply |
|---|---|
| June 2025 | 8.8 |
| July 2025 | 8.2 |
| August 2025 | 7.9 |
| September 2025 | 7.7 |
| October 2025 | 7.9 |
| November 2025 | 8.5 |
| December 2025 | 8.1 |
| January 2026 | 8.8 |
| February 2026 | 8.5 |
| March 2026 | 7.8 |
| April 2026 | 7.3 |
| May 2026 | 6.5 |
Source: Naples Area Board of REALTORS® (NABOR®) MLS, via InfoSparks. Data through May 2026. Data deemed reliable but not guaranteed.
Monitor real estate transaction volume in East Naples. Pending and closed sales reflect the pace of buyer demand and overall market momentum.
Pending Sales
185 as of June 2026, up 20.9% year-over-year.
| Month | Pending Sales |
|---|---|
| July 2025 | 163 |
| August 2025 | 151 |
| September 2025 | 177 |
| October 2025 | 172 |
| November 2025 | 140 |
| December 2025 | 136 |
| January 2026 | 219 |
| February 2026 | 270 |
| March 2026 | 266 |
| April 2026 | 240 |
| May 2026 | 210 |
| June 2026 | 185 |
Source: Naples Area Board of REALTORS® (NABOR®) MLS, via InfoSparks. Data through June 2026. Data deemed reliable but not guaranteed.
Total Sales
229 as of May 2026, up 37.1% year-over-year.
| Month | Total Sales |
|---|---|
| June 2025 | 196 |
| July 2025 | 179 |
| August 2025 | 163 |
| September 2025 | 157 |
| October 2025 | 183 |
| November 2025 | 124 |
| December 2025 | 192 |
| January 2026 | 125 |
| February 2026 | 182 |
| March 2026 | 280 |
| April 2026 | 244 |
| May 2026 | 229 |
Source: Naples Area Board of REALTORS® (NABOR®) MLS, via InfoSparks. Data through May 2026. Data deemed reliable but not guaranteed.
Pending Sales
185 as of June 2026, up 20.9% year-over-year.
| Month | Pending Sales |
|---|---|
| July 2025 | 163 |
| August 2025 | 151 |
| September 2025 | 177 |
| October 2025 | 172 |
| November 2025 | 140 |
| December 2025 | 136 |
| January 2026 | 219 |
| February 2026 | 270 |
| March 2026 | 266 |
| April 2026 | 240 |
| May 2026 | 210 |
| June 2026 | 185 |
Source: Naples Area Board of REALTORS® (NABOR®) MLS, via InfoSparks. Data through June 2026. Data deemed reliable but not guaranteed.
229 as of May 2026, up 37.1% year-over-year.
| Month | Total Sales |
|---|---|
| June 2025 | 196 |
| July 2025 | 179 |
| August 2025 | 163 |
| September 2025 | 157 |
| October 2025 | 183 |
| November 2025 | 124 |
| December 2025 | 192 |
| January 2026 | 125 |
| February 2026 | 182 |
| March 2026 | 280 |
| April 2026 | 244 |
| May 2026 | 229 |
Source: Naples Area Board of REALTORS® (NABOR®) MLS, via InfoSparks. Data through May 2026. Data deemed reliable but not guaranteed.
Bundled GolfGated bundled golf community in Naples with 27 holes of Arthur Hills–designed golf and resort-style amenities close to downtown and the beaches.
 community
Luxury golf club community spanning 1,115 acres in Naples with championship golf, dining, and resort-style amenities.
 community
Private, gated bundled golf community in East Naples with an Arnold Palmer Signature course and resort-style amenities.