 area
areaCoquina Sands
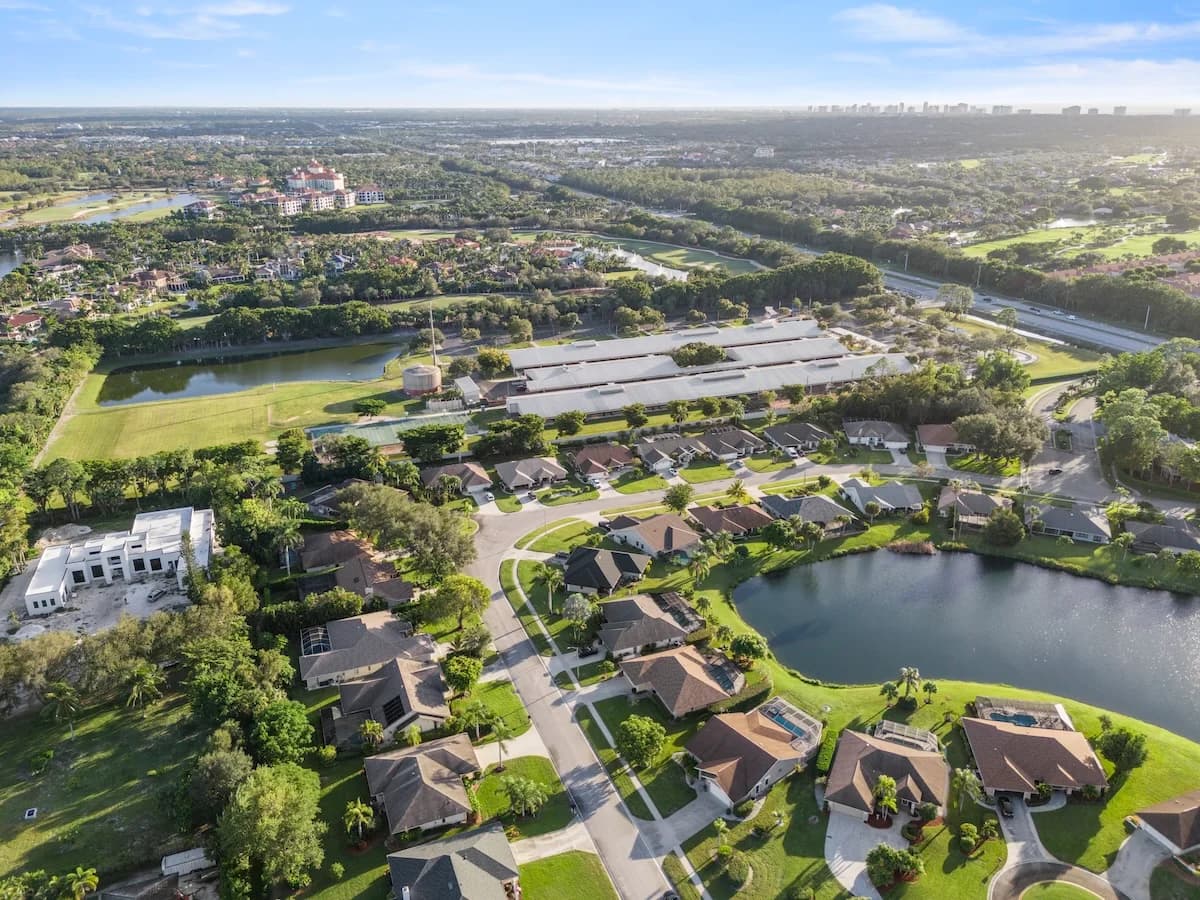
Coquina Sands is a coastal neighborhood just north of Olde Naples, known for its quiet streets, beach proximity, and mix of classic and newly constructed homes. The area offers a more understated residential setting while remaining close to the Gulf.
Beach Access & Surroundings
Residents enjoy convenient access to Lowdermilk Park, one of Naples’ most well-maintained beachfront parks, offering shaded areas, parking, and direct Gulf frontage. The neighborhood itself is defined by mature landscaping and a relaxed coastal atmosphere.
Location & Lifestyle
Located minutes from downtown Naples, Coquina Sands allows for easy access to dining and shopping while maintaining a quieter day-to-day environment. The combination of location and subtle character continues to make it a consistently appealing choice.
Properties for Sale
Market Snapshot
Here's the latest snapshot of the Coquina Sands real estate market in Naples, Florida. In April 2026, the median sales price reached $2,980,000. Recent volatility is evident, with the median sales price fluctuating significantly over the past year. Reviewing earlier data, we see highs of $9,625,000 in July 2023 and lows of $535,000 in March 2023, demonstrating considerable variation in property values within the community. Inventory levels in Coquina Sands remain substantial. Homes for sale numbered 43 in April 2026, a slight decrease from 45 in March 2026, but still elevated compared to earlier periods. Throughout 2025, the number of homes for sale generally trended upward, peaking at 46 in January 2026 and 53 in February 2026 before declining the past two months. This suggests a recent stabilization in the number of properties available. The months' supply of homes for sale indicates market balance. In April 2026, the months' supply was 16.5, down from 19.6 in March 2026 and 23.0 in February 2026. Reviewing the past year, we see the highest level was February 2025 at 23.7. Sales activity in Coquina Sands shows variable trends. Total sales in April 2026 were 6, up from 1 in March 2026, while pending sales were 4, down from 7 in March 2026. Median price per square foot was $1,100 in April 2026, up from $545 in March 2026.
May 2026 · Last updated May 1, 2026
Pricing
Track how home values are trending in Coquina Sands. Median sale prices and price-per-square-foot data help buyers and sellers gauge current market positioning.
Median Closed Price
$565,000 as of May 2026.
View monthly data
| Month | Median Closed Price |
|---|---|
| April 2025 | $650,000 |
| June 2025 | $9,300,000 |
| July 2025 | $3,082,500 |
| September 2025 | $6,175,000 |
| October 2025 | $1,600,000 |
| November 2025 | $9,250,000 |
| December 2025 | $4,575,000 |
| January 2026 | $620,000 |
| February 2026 | $583,500 |
| March 2026 | $580,000 |
| April 2026 | $2,980,000 |
| May 2026 | $565,000 |
Source: Naples Area Board of REALTORS® (NABOR®) MLS, via InfoSparks. Data through May 2026. Data deemed reliable but not guaranteed.
Median Prices per Sq ft
$1,079 as of June 2026, down 39.6% year-over-year.
View monthly data
| Month | Median Prices per Sq ft |
|---|---|
| June 2025 | $1,787 |
| July 2025 | $923 |
| September 2025 | $1,482 |
| October 2025 | $952 |
| November 2025 | $1,343 |
| December 2025 | $1,627 |
| January 2026 | $583 |
| February 2026 | $655 |
| March 2026 | $545 |
| April 2026 | $1,100 |
| May 2026 | $536 |
| June 2026 | $1,079 |
Source: Naples Area Board of REALTORS® (NABOR®) MLS, via InfoSparks. Data through June 2026. Data deemed reliable but not guaranteed.
Median Closed Price
$565,000 as of May 2026.
View monthly data
| Month | Median Closed Price |
|---|---|
| April 2025 | $650,000 |
| June 2025 | $9,300,000 |
| July 2025 | $3,082,500 |
| September 2025 | $6,175,000 |
| October 2025 | $1,600,000 |
| November 2025 | $9,250,000 |
| December 2025 | $4,575,000 |
| January 2026 | $620,000 |
| February 2026 | $583,500 |
| March 2026 | $580,000 |
| April 2026 | $2,980,000 |
| May 2026 | $565,000 |
Source: Naples Area Board of REALTORS® (NABOR®) MLS, via InfoSparks. Data through May 2026. Data deemed reliable but not guaranteed.
$1,079 as of June 2026, down 39.6% year-over-year.
View monthly data
| Month | Median Prices per Sq ft |
|---|---|
| June 2025 | $1,787 |
| July 2025 | $923 |
| September 2025 | $1,482 |
| October 2025 | $952 |
| November 2025 | $1,343 |
| December 2025 | $1,627 |
| January 2026 | $583 |
| February 2026 | $655 |
| March 2026 | $545 |
| April 2026 | $1,100 |
| May 2026 | $536 |
| June 2026 | $1,079 |
Source: Naples Area Board of REALTORS® (NABOR®) MLS, via InfoSparks. Data through June 2026. Data deemed reliable but not guaranteed.
Inventory
See how many homes are available in Coquina Sands and how quickly inventory is moving. Months of supply indicates whether conditions favor buyers or sellers.
Homes For Sale
38 as of May 2026, up 5.6% year-over-year.
View monthly data
| Month | Homes For Sale |
|---|---|
| June 2025 | 33 |
| July 2025 | 31 |
| August 2025 | 32 |
| September 2025 | 31 |
| October 2025 | 36 |
| November 2025 | 39 |
| December 2025 | 40 |
| January 2026 | 46 |
| February 2026 | 53 |
| March 2026 | 45 |
| April 2026 | 42 |
| May 2026 | 38 |
Source: Naples Area Board of REALTORS® (NABOR®) MLS, via InfoSparks. Data through May 2026. Data deemed reliable but not guaranteed.
Months Supply
11.4 as of June 2026, down 38.7% year-over-year.
View monthly data
| Month | Months Supply |
|---|---|
| July 2025 | 17.4 |
| August 2025 | 21.3 |
| September 2025 | 19.1 |
| October 2025 | 24 |
| November 2025 | 22.3 |
| December 2025 | 20 |
| January 2026 | 19.7 |
| February 2026 | 23 |
| March 2026 | 19.6 |
| April 2026 | 16.2 |
| May 2026 | 14.4 |
| June 2026 | 11.4 |
Source: Naples Area Board of REALTORS® (NABOR®) MLS, via InfoSparks. Data through June 2026. Data deemed reliable but not guaranteed.
Homes For Sale
38 as of May 2026, up 5.6% year-over-year.
View monthly data
| Month | Homes For Sale |
|---|---|
| June 2025 | 33 |
| July 2025 | 31 |
| August 2025 | 32 |
| September 2025 | 31 |
| October 2025 | 36 |
| November 2025 | 39 |
| December 2025 | 40 |
| January 2026 | 46 |
| February 2026 | 53 |
| March 2026 | 45 |
| April 2026 | 42 |
| May 2026 | 38 |
Source: Naples Area Board of REALTORS® (NABOR®) MLS, via InfoSparks. Data through May 2026. Data deemed reliable but not guaranteed.
11.4 as of June 2026, down 38.7% year-over-year.
View monthly data
| Month | Months Supply |
|---|---|
| July 2025 | 17.4 |
| August 2025 | 21.3 |
| September 2025 | 19.1 |
| October 2025 | 24 |
| November 2025 | 22.3 |
| December 2025 | 20 |
| January 2026 | 19.7 |
| February 2026 | 23 |
| March 2026 | 19.6 |
| April 2026 | 16.2 |
| May 2026 | 14.4 |
| June 2026 | 11.4 |
Source: Naples Area Board of REALTORS® (NABOR®) MLS, via InfoSparks. Data through June 2026. Data deemed reliable but not guaranteed.
Activity
Monitor real estate transaction volume in Coquina Sands. Pending and closed sales reflect the pace of buyer demand and overall market momentum.
Pending Sales
3 as of May 2026, up 0.0% year-over-year.
View monthly data
| Month | Pending Sales |
|---|---|
| June 2025 | 0 |
| July 2025 | 1 |
| August 2025 | 1 |
| September 2025 | 3 |
| October 2025 | 1 |
| November 2025 | 4 |
| December 2025 | 2 |
| January 2026 | 4 |
| February 2026 | 0 |
| March 2026 | 7 |
| April 2026 | 4 |
| May 2026 | 3 |
Source: Naples Area Board of REALTORS® (NABOR®) MLS, via InfoSparks. Data through May 2026. Data deemed reliable but not guaranteed.
Total Sales
3 as of June 2026, up 200.0% year-over-year.
View monthly data
| Month | Total Sales |
|---|---|
| July 2025 | 2 |
| August 2025 | 0 |
| September 2025 | 2 |
| October 2025 | 1 |
| November 2025 | 3 |
| December 2025 | 3 |
| January 2026 | 5 |
| February 2026 | 2 |
| March 2026 | 1 |
| April 2026 | 6 |
| May 2026 | 3 |
| June 2026 | 3 |
Source: Naples Area Board of REALTORS® (NABOR®) MLS, via InfoSparks. Data through June 2026. Data deemed reliable but not guaranteed.
Pending Sales
3 as of May 2026, up 0.0% year-over-year.
View monthly data
| Month | Pending Sales |
|---|---|
| June 2025 | 0 |
| July 2025 | 1 |
| August 2025 | 1 |
| September 2025 | 3 |
| October 2025 | 1 |
| November 2025 | 4 |
| December 2025 | 2 |
| January 2026 | 4 |
| February 2026 | 0 |
| March 2026 | 7 |
| April 2026 | 4 |
| May 2026 | 3 |
Source: Naples Area Board of REALTORS® (NABOR®) MLS, via InfoSparks. Data through May 2026. Data deemed reliable but not guaranteed.
3 as of June 2026, up 200.0% year-over-year.
View monthly data
| Month | Total Sales |
|---|---|
| July 2025 | 2 |
| August 2025 | 0 |
| September 2025 | 2 |
| October 2025 | 1 |
| November 2025 | 3 |
| December 2025 | 3 |
| January 2026 | 5 |
| February 2026 | 2 |
| March 2026 | 1 |
| April 2026 | 6 |
| May 2026 | 3 |
| June 2026 | 3 |
Source: Naples Area Board of REALTORS® (NABOR®) MLS, via InfoSparks. Data through June 2026. Data deemed reliable but not guaranteed.