 building
Naples • Moorings
Billows
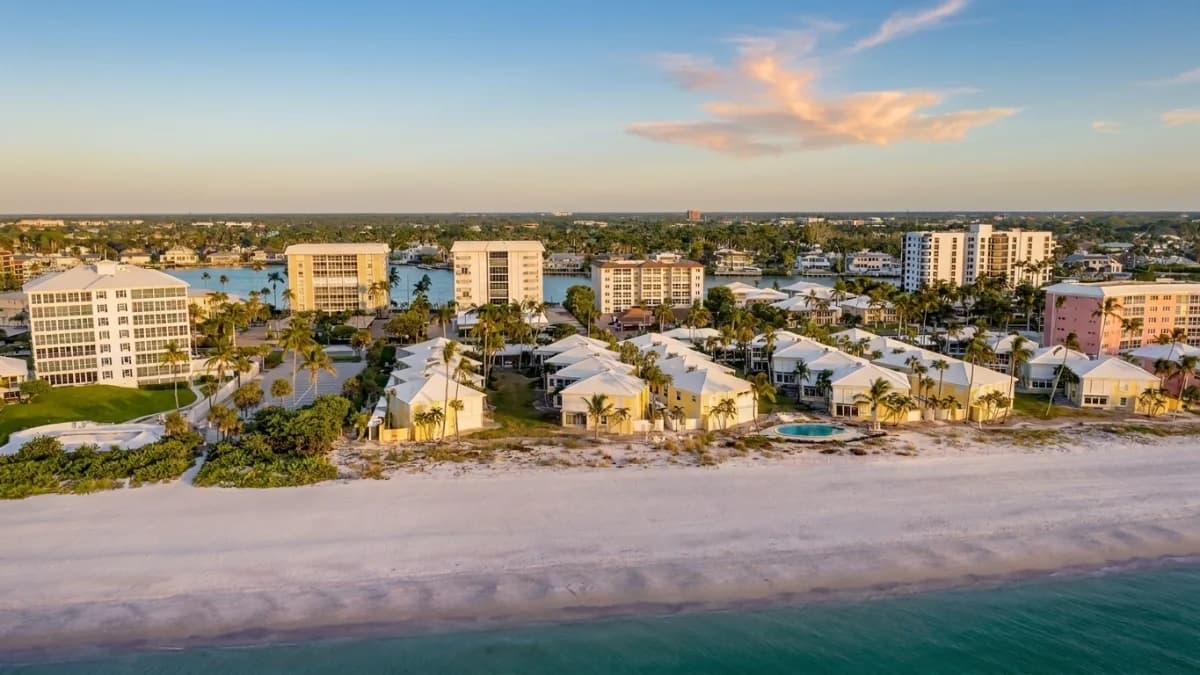
Beachfront cooperative community in The Moorings with 48 residences across four low-rise buildings.
~$950k+
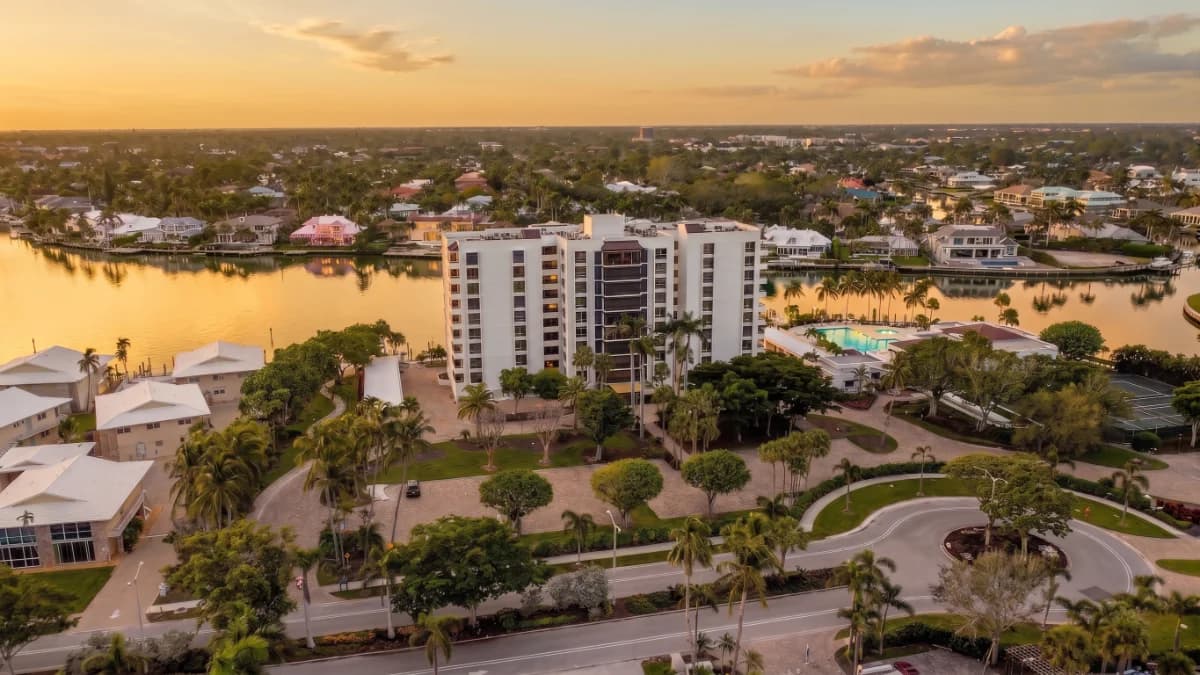
Admiralty Point 2, also known as the East Building, is a prestigious nine-story condominium building located at the southern tip of The Moorings neighborhood in Naples. Completed in 1981, this 45-unit luxury building sits on a ten-acre peninsula shared with Admiralty Point 1, surrounded by water on three sides—fronting the Gulf of Mexico, Doctors Pass, and Moorings Bay.
All apartments feature unobstructed views of Moorings Bay, with upper floors enjoying both gulf and bay views. The building offers three different floor plans ranging from approximately 1,515 to 2,033 square feet for the standard units. Each residence includes underground parking, with some units featuring individual garages with doors. Most units have been completely renovated by residents to modern luxury standards.
This gated, family-friendly community provides direct beach access and maintains 24 boat slips available for lease. The property features two refurbished pools with granite tops, a new west clubhouse, tennis courts, shuffleboard, exercise room, and BBQ areas. Recent improvements include new windows, major exterior renovations, new barbecue grills, and replacement of river rock with non-slip tile.
Admiralty Point 2 enjoys a prime location at 2400 Gulf Shore Blvd N, offering the perfect combination of beachfront and bayfront living with no bridges to the Gulf. The community maintains 24-hour security with a gate, guard, and entry phone system, ensuring privacy and peace of mind for residents.
Track how home values are trending in Admiralty Point 2. Median sale prices and price-per-square-foot data help buyers and sellers gauge current market positioning.
Median Closed Price
$1,662,500 as of May 2026.
| Month | Median Closed Price |
|---|---|
| January 2024 | $3,000,000 |
| March 2024 | $1,450,000 |
| May 2024 | $2,395,000 |
| August 2024 | $1,840,000 |
| March 2025 | $2,900,000 |
| April 2025 | $1,705,000 |
| November 2025 | $3,150,000 |
| December 2025 | $1,600,000 |
| February 2026 | $1,925,000 |
| March 2026 | $2,675,000 |
| April 2026 | $2,083,750 |
| May 2026 | $1,662,500 |
Source: Naples Area Board of REALTORS® (NABOR®) MLS, via InfoSparks. Data through May 2026. Data deemed reliable but not guaranteed.
Median Prices per Sq ft
$807 as of May 2026.
| Month | Median Prices per Sq ft |
|---|---|
| January 2024 | $1,354 |
| March 2024 | $879 |
| May 2024 | $1,452 |
| August 2024 | $917 |
| March 2025 | $1,489 |
| April 2025 | $1,017 |
| November 2025 | $1,078 |
| December 2025 | $870 |
| February 2026 | $1,060 |
| March 2026 | $1,245 |
| April 2026 | $1,009 |
| May 2026 | $807 |
Source: Naples Area Board of REALTORS® (NABOR®) MLS, via InfoSparks. Data through May 2026. Data deemed reliable but not guaranteed.
Median Closed Price
$1,662,500 as of May 2026.
| Month | Median Closed Price |
|---|---|
| January 2024 | $3,000,000 |
| March 2024 | $1,450,000 |
| May 2024 | $2,395,000 |
| August 2024 | $1,840,000 |
| March 2025 | $2,900,000 |
| April 2025 | $1,705,000 |
| November 2025 | $3,150,000 |
| December 2025 | $1,600,000 |
| February 2026 | $1,925,000 |
| March 2026 | $2,675,000 |
| April 2026 | $2,083,750 |
| May 2026 | $1,662,500 |
Source: Naples Area Board of REALTORS® (NABOR®) MLS, via InfoSparks. Data through May 2026. Data deemed reliable but not guaranteed.
$807 as of May 2026.
| Month | Median Prices per Sq ft |
|---|---|
| January 2024 | $1,354 |
| March 2024 | $879 |
| May 2024 | $1,452 |
| August 2024 | $917 |
| March 2025 | $1,489 |
| April 2025 | $1,017 |
| November 2025 | $1,078 |
| December 2025 | $870 |
| February 2026 | $1,060 |
| March 2026 | $1,245 |
| April 2026 | $1,009 |
| May 2026 | $807 |
Source: Naples Area Board of REALTORS® (NABOR®) MLS, via InfoSparks. Data through May 2026. Data deemed reliable but not guaranteed.
See how many homes are available in Admiralty Point 2 and how quickly inventory is moving. Months of supply indicates whether conditions favor buyers or sellers.
Homes For Sale
7 as of May 2026, down 46.2% year-over-year.
| Month | Homes For Sale |
|---|---|
| June 2025 | 13 |
| July 2025 | 13 |
| August 2025 | 14 |
| September 2025 | 13 |
| October 2025 | 14 |
| November 2025 | 18 |
| December 2025 | 14 |
| January 2026 | 16 |
| February 2026 | 14 |
| March 2026 | 12 |
| April 2026 | 9 |
| May 2026 | 7 |
Source: Naples Area Board of REALTORS® (NABOR®) MLS, via InfoSparks. Data through May 2026. Data deemed reliable but not guaranteed.
Months Supply
3.8 as of June 2026, down 70.8% year-over-year.
| Month | Months Supply |
|---|---|
| July 2025 | 13 |
| August 2025 | 14 |
| September 2025 | 13 |
| October 2025 | 14 |
| November 2025 | 18 |
| December 2025 | 14 |
| January 2026 | 16 |
| February 2026 | 14 |
| March 2026 | 10 |
| April 2026 | 6.4 |
| May 2026 | 3.8 |
| June 2026 | 3.8 |
Source: Naples Area Board of REALTORS® (NABOR®) MLS, via InfoSparks. Data through June 2026. Data deemed reliable but not guaranteed.
Homes For Sale
7 as of May 2026, down 46.2% year-over-year.
| Month | Homes For Sale |
|---|---|
| June 2025 | 13 |
| July 2025 | 13 |
| August 2025 | 14 |
| September 2025 | 13 |
| October 2025 | 14 |
| November 2025 | 18 |
| December 2025 | 14 |
| January 2026 | 16 |
| February 2026 | 14 |
| March 2026 | 12 |
| April 2026 | 9 |
| May 2026 | 7 |
Source: Naples Area Board of REALTORS® (NABOR®) MLS, via InfoSparks. Data through May 2026. Data deemed reliable but not guaranteed.
3.8 as of June 2026, down 70.8% year-over-year.
| Month | Months Supply |
|---|---|
| July 2025 | 13 |
| August 2025 | 14 |
| September 2025 | 13 |
| October 2025 | 14 |
| November 2025 | 18 |
| December 2025 | 14 |
| January 2026 | 16 |
| February 2026 | 14 |
| March 2026 | 10 |
| April 2026 | 6.4 |
| May 2026 | 3.8 |
| June 2026 | 3.8 |
Source: Naples Area Board of REALTORS® (NABOR®) MLS, via InfoSparks. Data through June 2026. Data deemed reliable but not guaranteed.
Monitor real estate transaction volume in Admiralty Point 2. Pending and closed sales reflect the pace of buyer demand and overall market momentum.
Pending Sales
0 as of June 2026.
| Month | Pending Sales |
|---|---|
| July 2025 | 0 |
| August 2025 | 0 |
| September 2025 | 0 |
| October 2025 | 1 |
| November 2025 | 0 |
| December 2025 | 2 |
| January 2026 | 0 |
| February 2026 | 2 |
| March 2026 | 3 |
| April 2026 | 2 |
| May 2026 | 1 |
| June 2026 | 0 |
Source: Naples Area Board of REALTORS® (NABOR®) MLS, via InfoSparks. Data through June 2026. Data deemed reliable but not guaranteed.
Total Sales
0 as of June 2026.
| Month | Total Sales |
|---|---|
| July 2025 | 0 |
| August 2025 | 0 |
| September 2025 | 0 |
| October 2025 | 0 |
| November 2025 | 1 |
| December 2025 | 1 |
| January 2026 | 0 |
| February 2026 | 1 |
| March 2026 | 2 |
| April 2026 | 2 |
| May 2026 | 4 |
| June 2026 | 0 |
Source: Naples Area Board of REALTORS® (NABOR®) MLS, via InfoSparks. Data through June 2026. Data deemed reliable but not guaranteed.
Pending Sales
0 as of June 2026.
| Month | Pending Sales |
|---|---|
| July 2025 | 0 |
| August 2025 | 0 |
| September 2025 | 0 |
| October 2025 | 1 |
| November 2025 | 0 |
| December 2025 | 2 |
| January 2026 | 0 |
| February 2026 | 2 |
| March 2026 | 3 |
| April 2026 | 2 |
| May 2026 | 1 |
| June 2026 | 0 |
Source: Naples Area Board of REALTORS® (NABOR®) MLS, via InfoSparks. Data through June 2026. Data deemed reliable but not guaranteed.
0 as of June 2026.
| Month | Total Sales |
|---|---|
| July 2025 | 0 |
| August 2025 | 0 |
| September 2025 | 0 |
| October 2025 | 0 |
| November 2025 | 1 |
| December 2025 | 1 |
| January 2026 | 0 |
| February 2026 | 1 |
| March 2026 | 2 |
| April 2026 | 2 |
| May 2026 | 4 |
| June 2026 | 0 |
Source: Naples Area Board of REALTORS® (NABOR®) MLS, via InfoSparks. Data through June 2026. Data deemed reliable but not guaranteed.
buildingBeachfront cooperative community in The Moorings with 48 residences across four low-rise buildings.
Exclusive beachfront cooperative in Moorings with 33 residences, built in 1971, offering private beach access and luxury coastal living.
Bayfront luxury condominiums in the Moorings with Gulf views, boat slips, and beach access.
buildingBeachfront cooperative community in The Moorings with 48 residences across four low-rise buildings.
Exclusive beachfront cooperative in Moorings with 33 residences, built in 1971, offering private beach access and luxury coastal living.
Bayfront luxury condominiums in the Moorings with Gulf views, boat slips, and beach access.
 location
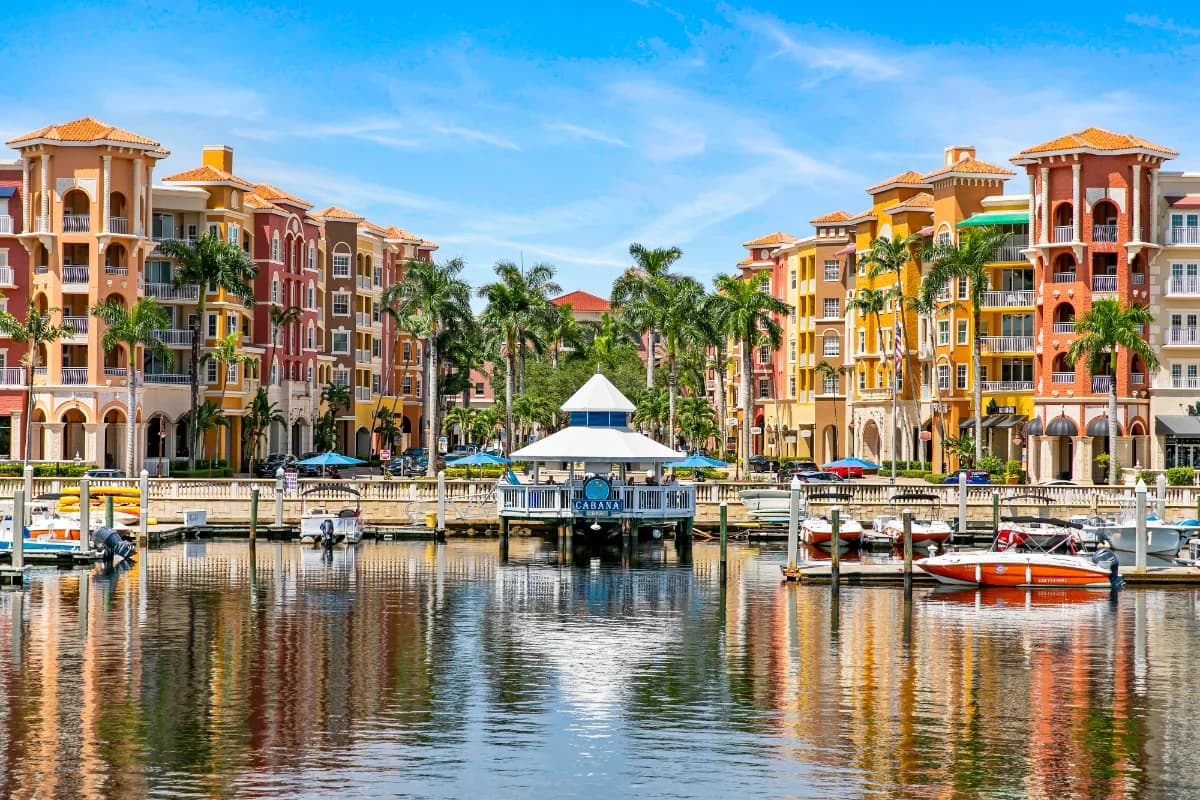
World-class beaches, golf, and coastal lifestyle in Southwest Florida.
 area
area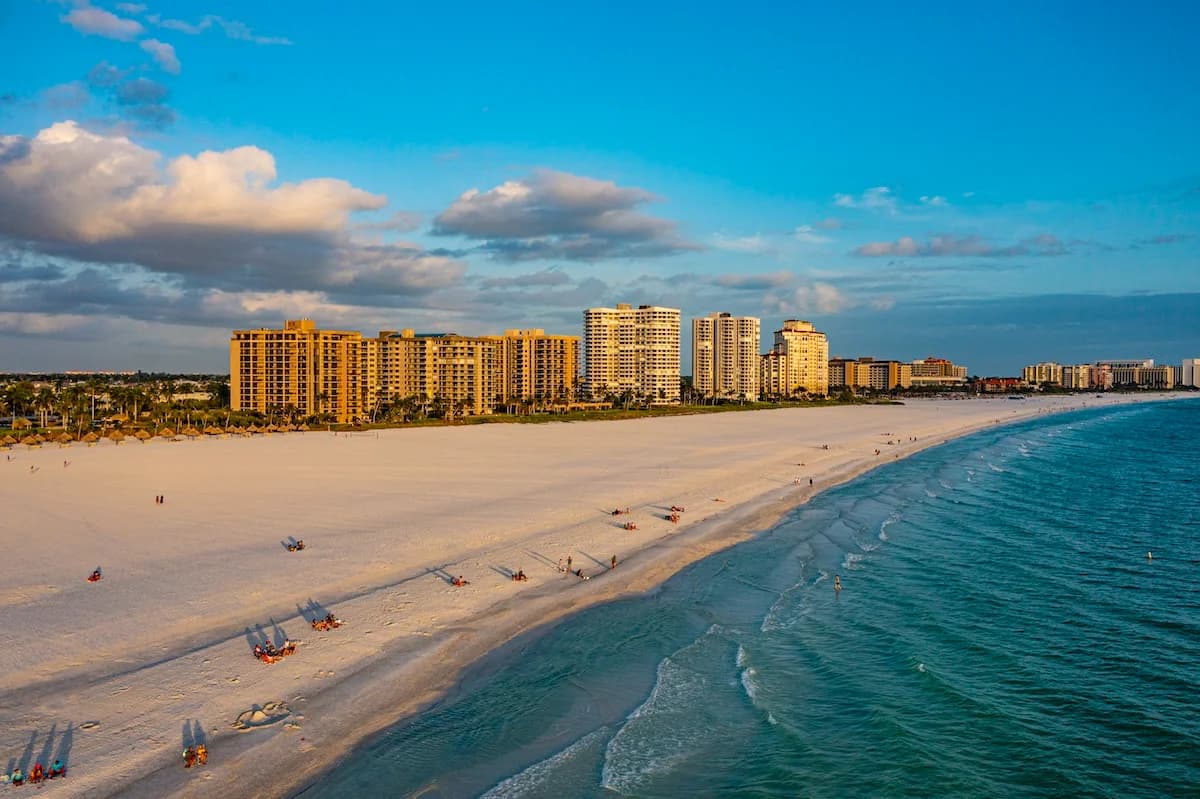 location
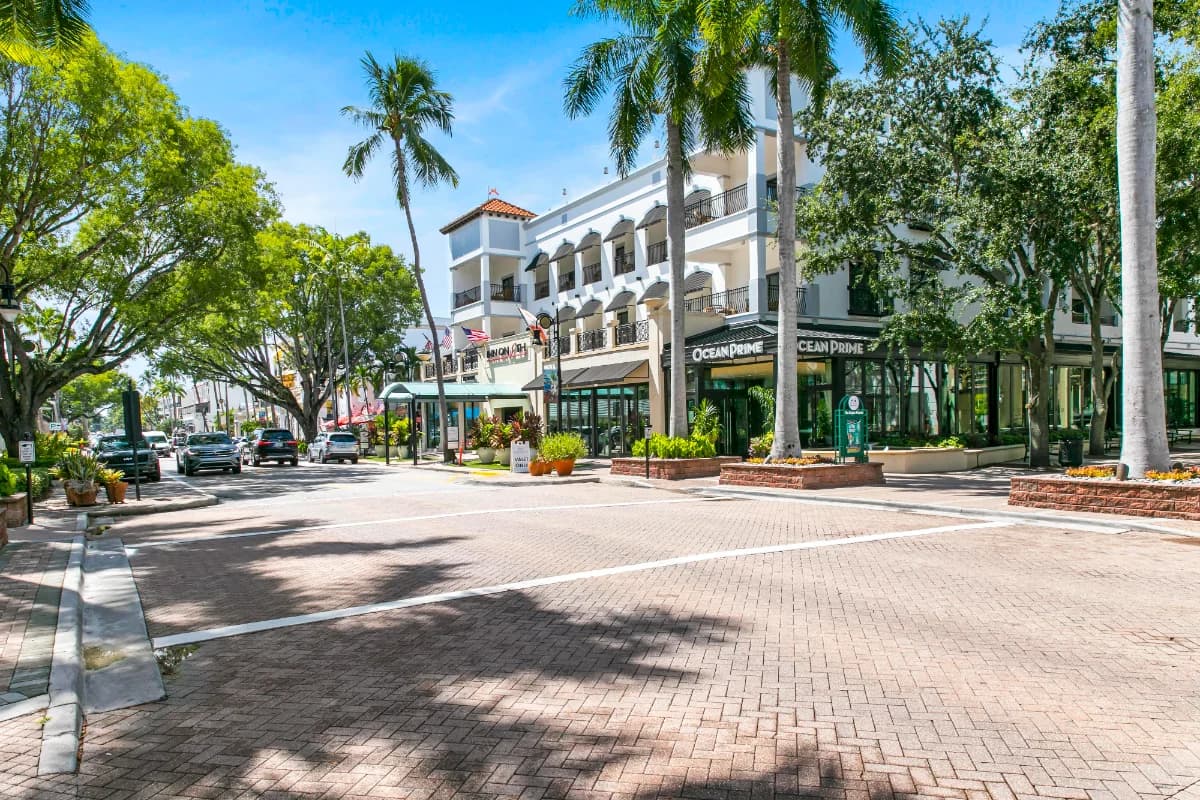
Island living with white-sand beaches and boating lifestyle.
locationWorld-class beaches, golf, and coastal lifestyle in Southwest Florida.
arealocationIsland living with white-sand beaches and boating lifestyle.