 building
Naples • Moorings
Billows
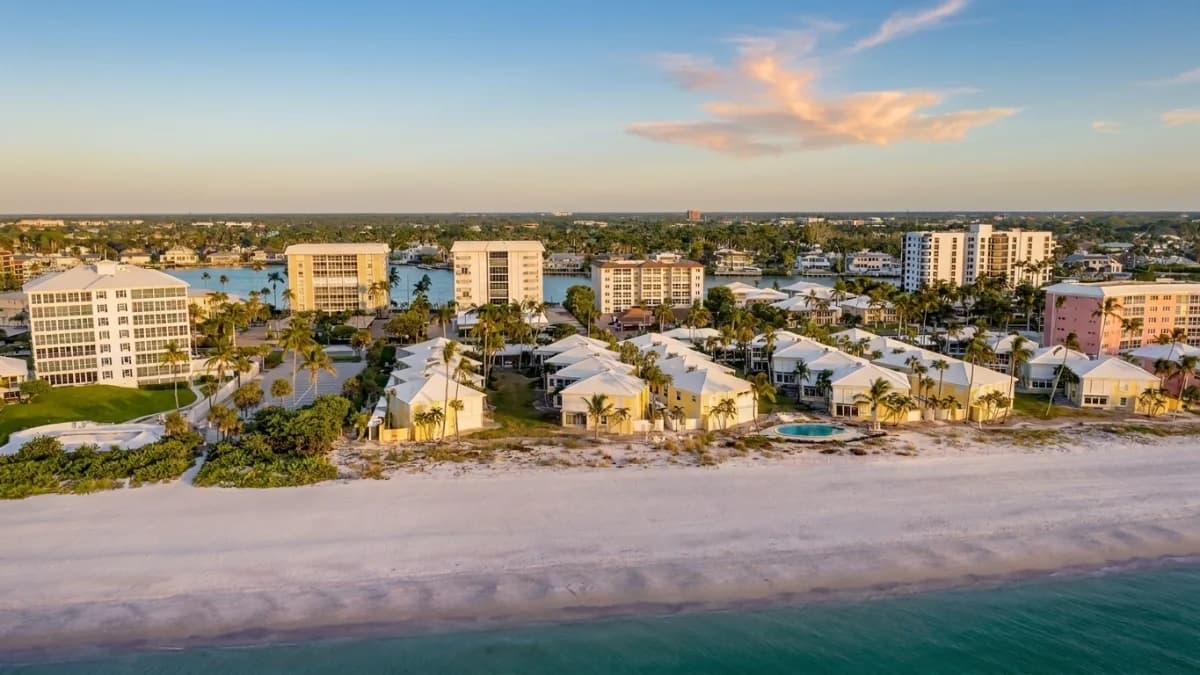
Beachfront cooperative community in The Moorings with 48 residences across four low-rise buildings.
~$950k+
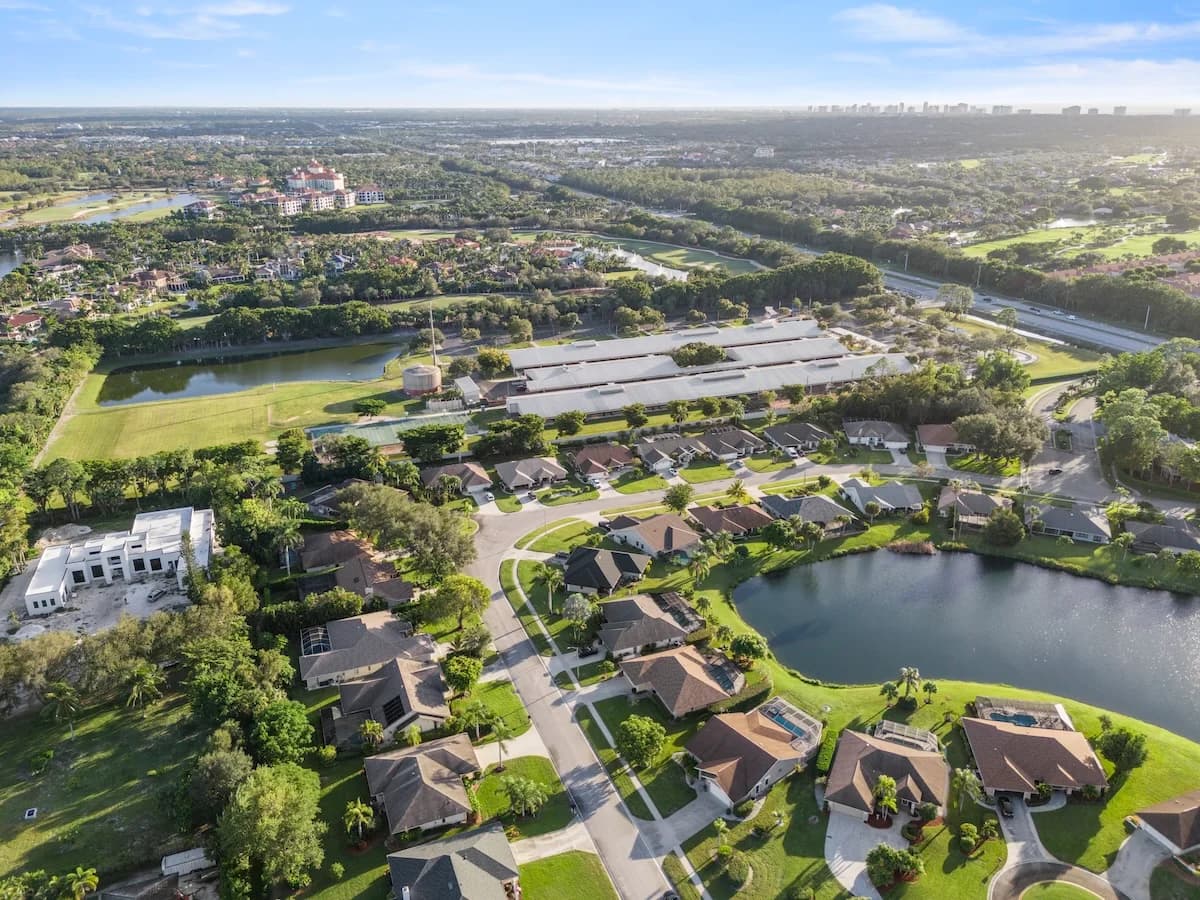
The Moorings is a centrally located waterfront community recognized for its deep-water access, larger homesites, and private beach privileges. Developed in the 1960s, it remains one of Naples’ most enduring neighborhoods, offering a mix of renovated ranch homes, new construction, and waterfront estates.
With direct Gulf access and no bridges in many locations, The Moorings is particularly appealing to boating enthusiasts. Private docks are common along the canals, and residents have the option to join the Moorings Property Owners Association for access to a private beach park.
Positioned just minutes from both Olde Naples and Venetian Village, The Moorings provides a central location without sacrificing privacy. The neighborhood’s wide streets, mature landscaping, and proximity to daily conveniences create a lifestyle that is both practical and quietly refined.
Here's a snapshot of the real estate market in Moorings, Naples, as of early May 2026. The median sales price in April 2026 was $1,600,000, holding steady compared to January 2026. Notable fluctuations occurred over the past year, with a high of $2,900,000 in March 2025 and a low of $632,000 in November 2025. The median price per square foot in April 2026 stood at $937, a slight increase from $872 in January 2026. Inventory levels in Moorings continue to be elevated. The number of homes for sale in April 2026 was 184, down from 223 in January 2026. Looking back, inventory peaked in March 2025 at 250 available properties and has generally trended downward since then. Sales activity in Moorings is showing an upward trend. Total sales in April 2026 reached 33, a notable increase from 15 sales in January 2026. Likewise, pending sales have also increased, with 38 pending sales in April 2026 compared to 26 in January 2026. The months' supply of homes for sale was 11.2 in April 2026, down from 16.5 in January 2026, indicating a faster sales pace.
May 2026 · Last updated May 2, 2026
Track how home values are trending in Moorings. Median sale prices and price-per-square-foot data help buyers and sellers gauge current market positioning.
Median Closed Price
$1,080,500 as of June 2026, down 30.3% year-over-year.
| Month | Median Closed Price |
|---|---|
| July 2025 | $749,500 |
| August 2025 | $1,850,000 |
| September 2025 | $1,589,000 |
| October 2025 | $1,300,000 |
| November 2025 | $632,000 |
| December 2025 | $1,227,500 |
| January 2026 | $1,600,000 |
| February 2026 | $1,010,000 |
| March 2026 | $900,000 |
| April 2026 | $1,600,000 |
| May 2026 | $1,531,000 |
| June 2026 | $1,080,500 |
Source: Naples Area Board of REALTORS® (NABOR®) MLS, via InfoSparks. Data through June 2026. Data deemed reliable but not guaranteed.
Median Prices per Sq ft
$777 as of June 2026, down 15.0% year-over-year.
| Month | Median Prices per Sq ft |
|---|---|
| July 2025 | $505 |
| August 2025 | $998 |
| September 2025 | $802 |
| October 2025 | $784 |
| November 2025 | $546 |
| December 2025 | $761 |
| January 2026 | $872 |
| February 2026 | $723 |
| March 2026 | $712 |
| April 2026 | $937 |
| May 2026 | $833 |
| June 2026 | $777 |
Source: Naples Area Board of REALTORS® (NABOR®) MLS, via InfoSparks. Data through June 2026. Data deemed reliable but not guaranteed.
Median Closed Price
$1,080,500 as of June 2026, down 30.3% year-over-year.
| Month | Median Closed Price |
|---|---|
| July 2025 | $749,500 |
| August 2025 | $1,850,000 |
| September 2025 | $1,589,000 |
| October 2025 | $1,300,000 |
| November 2025 | $632,000 |
| December 2025 | $1,227,500 |
| January 2026 | $1,600,000 |
| February 2026 | $1,010,000 |
| March 2026 | $900,000 |
| April 2026 | $1,600,000 |
| May 2026 | $1,531,000 |
| June 2026 | $1,080,500 |
Source: Naples Area Board of REALTORS® (NABOR®) MLS, via InfoSparks. Data through June 2026. Data deemed reliable but not guaranteed.
$777 as of June 2026, down 15.0% year-over-year.
| Month | Median Prices per Sq ft |
|---|---|
| July 2025 | $505 |
| August 2025 | $998 |
| September 2025 | $802 |
| October 2025 | $784 |
| November 2025 | $546 |
| December 2025 | $761 |
| January 2026 | $872 |
| February 2026 | $723 |
| March 2026 | $712 |
| April 2026 | $937 |
| May 2026 | $833 |
| June 2026 | $777 |
Source: Naples Area Board of REALTORS® (NABOR®) MLS, via InfoSparks. Data through June 2026. Data deemed reliable but not guaranteed.
See how many homes are available in Moorings and how quickly inventory is moving. Months of supply indicates whether conditions favor buyers or sellers.
Homes For Sale
145 as of June 2026, down 27.5% year-over-year.
| Month | Homes For Sale |
|---|---|
| July 2025 | 173 |
| August 2025 | 158 |
| September 2025 | 147 |
| October 2025 | 178 |
| November 2025 | 212 |
| December 2025 | 209 |
| January 2026 | 223 |
| February 2026 | 231 |
| March 2026 | 220 |
| April 2026 | 188 |
| May 2026 | 156 |
| June 2026 | 145 |
Source: Naples Area Board of REALTORS® (NABOR®) MLS, via InfoSparks. Data through June 2026. Data deemed reliable but not guaranteed.
Months Supply
8.9 as of May 2026, down 50.6% year-over-year.
| Month | Months Supply |
|---|---|
| June 2025 | 16.6 |
| July 2025 | 14.1 |
| August 2025 | 12.7 |
| September 2025 | 11.4 |
| October 2025 | 13.5 |
| November 2025 | 16 |
| December 2025 | 15.7 |
| January 2026 | 16.5 |
| February 2026 | 15.6 |
| March 2026 | 14 |
| April 2026 | 11.4 |
| May 2026 | 8.9 |
Source: Naples Area Board of REALTORS® (NABOR®) MLS, via InfoSparks. Data through May 2026. Data deemed reliable but not guaranteed.
Homes For Sale
145 as of June 2026, down 27.5% year-over-year.
| Month | Homes For Sale |
|---|---|
| July 2025 | 173 |
| August 2025 | 158 |
| September 2025 | 147 |
| October 2025 | 178 |
| November 2025 | 212 |
| December 2025 | 209 |
| January 2026 | 223 |
| February 2026 | 231 |
| March 2026 | 220 |
| April 2026 | 188 |
| May 2026 | 156 |
| June 2026 | 145 |
Source: Naples Area Board of REALTORS® (NABOR®) MLS, via InfoSparks. Data through June 2026. Data deemed reliable but not guaranteed.
8.9 as of May 2026, down 50.6% year-over-year.
| Month | Months Supply |
|---|---|
| June 2025 | 16.6 |
| July 2025 | 14.1 |
| August 2025 | 12.7 |
| September 2025 | 11.4 |
| October 2025 | 13.5 |
| November 2025 | 16 |
| December 2025 | 15.7 |
| January 2026 | 16.5 |
| February 2026 | 15.6 |
| March 2026 | 14 |
| April 2026 | 11.4 |
| May 2026 | 8.9 |
Source: Naples Area Board of REALTORS® (NABOR®) MLS, via InfoSparks. Data through May 2026. Data deemed reliable but not guaranteed.
Monitor real estate transaction volume in Moorings. Pending and closed sales reflect the pace of buyer demand and overall market momentum.
Pending Sales
11 as of June 2026, up 22.2% year-over-year.
| Month | Pending Sales |
|---|---|
| July 2025 | 14 |
| August 2025 | 6 |
| September 2025 | 10 |
| October 2025 | 12 |
| November 2025 | 13 |
| December 2025 | 16 |
| January 2026 | 26 |
| February 2026 | 23 |
| March 2026 | 33 |
| April 2026 | 39 |
| May 2026 | 18 |
| June 2026 | 11 |
Source: Naples Area Board of REALTORS® (NABOR®) MLS, via InfoSparks. Data through June 2026. Data deemed reliable but not guaranteed.
Total Sales
20 as of June 2026, up 25.0% year-over-year.
| Month | Total Sales |
|---|---|
| July 2025 | 10 |
| August 2025 | 12 |
| September 2025 | 11 |
| October 2025 | 10 |
| November 2025 | 10 |
| December 2025 | 10 |
| January 2026 | 15 |
| February 2026 | 25 |
| March 2026 | 25 |
| April 2026 | 33 |
| May 2026 | 32 |
| June 2026 | 20 |
Source: Naples Area Board of REALTORS® (NABOR®) MLS, via InfoSparks. Data through June 2026. Data deemed reliable but not guaranteed.
Pending Sales
11 as of June 2026, up 22.2% year-over-year.
| Month | Pending Sales |
|---|---|
| July 2025 | 14 |
| August 2025 | 6 |
| September 2025 | 10 |
| October 2025 | 12 |
| November 2025 | 13 |
| December 2025 | 16 |
| January 2026 | 26 |
| February 2026 | 23 |
| March 2026 | 33 |
| April 2026 | 39 |
| May 2026 | 18 |
| June 2026 | 11 |
Source: Naples Area Board of REALTORS® (NABOR®) MLS, via InfoSparks. Data through June 2026. Data deemed reliable but not guaranteed.
20 as of June 2026, up 25.0% year-over-year.
| Month | Total Sales |
|---|---|
| July 2025 | 10 |
| August 2025 | 12 |
| September 2025 | 11 |
| October 2025 | 10 |
| November 2025 | 10 |
| December 2025 | 10 |
| January 2026 | 15 |
| February 2026 | 25 |
| March 2026 | 25 |
| April 2026 | 33 |
| May 2026 | 32 |
| June 2026 | 20 |
Source: Naples Area Board of REALTORS® (NABOR®) MLS, via InfoSparks. Data through June 2026. Data deemed reliable but not guaranteed.
buildingBeachfront cooperative community in The Moorings with 48 residences across four low-rise buildings.
Exclusive beachfront cooperative in Moorings with 33 residences, built in 1971, offering private beach access and luxury coastal living.
Bayfront luxury condominiums in the Moorings with Gulf views, boat slips, and beach access.