La Tour Rivage
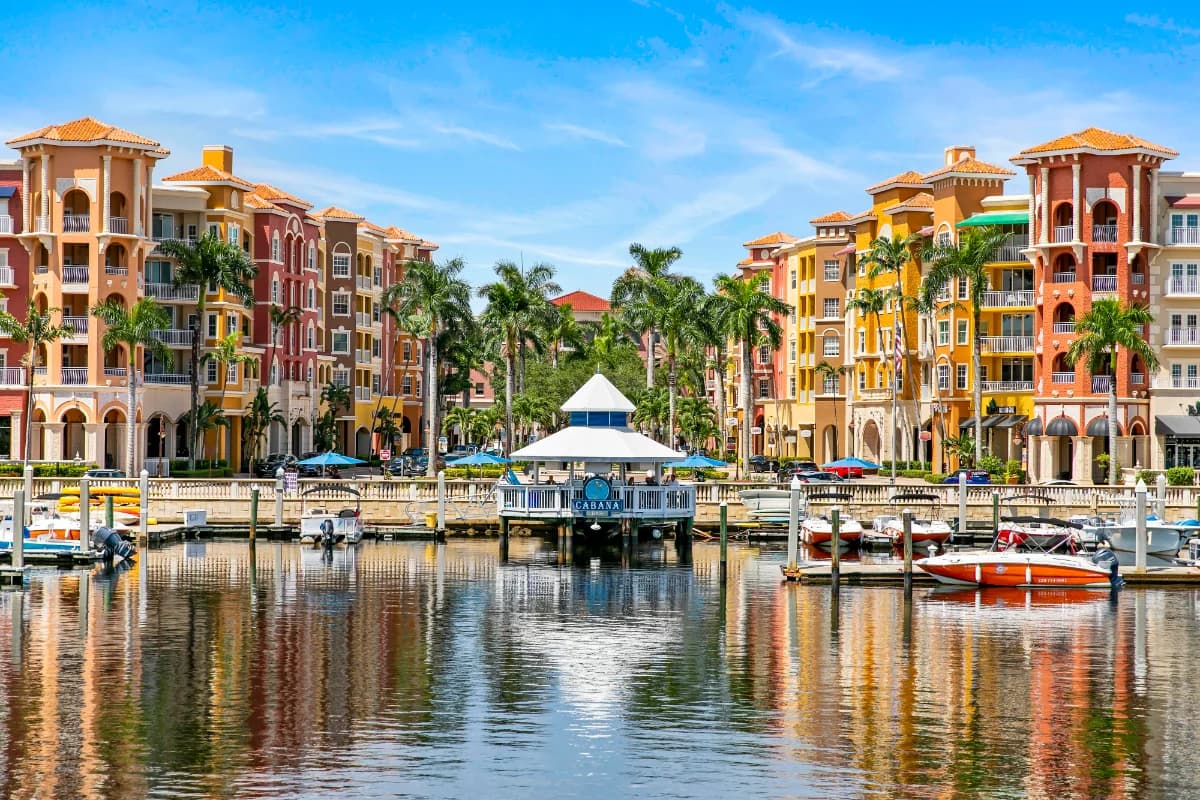
Waterfront / boating
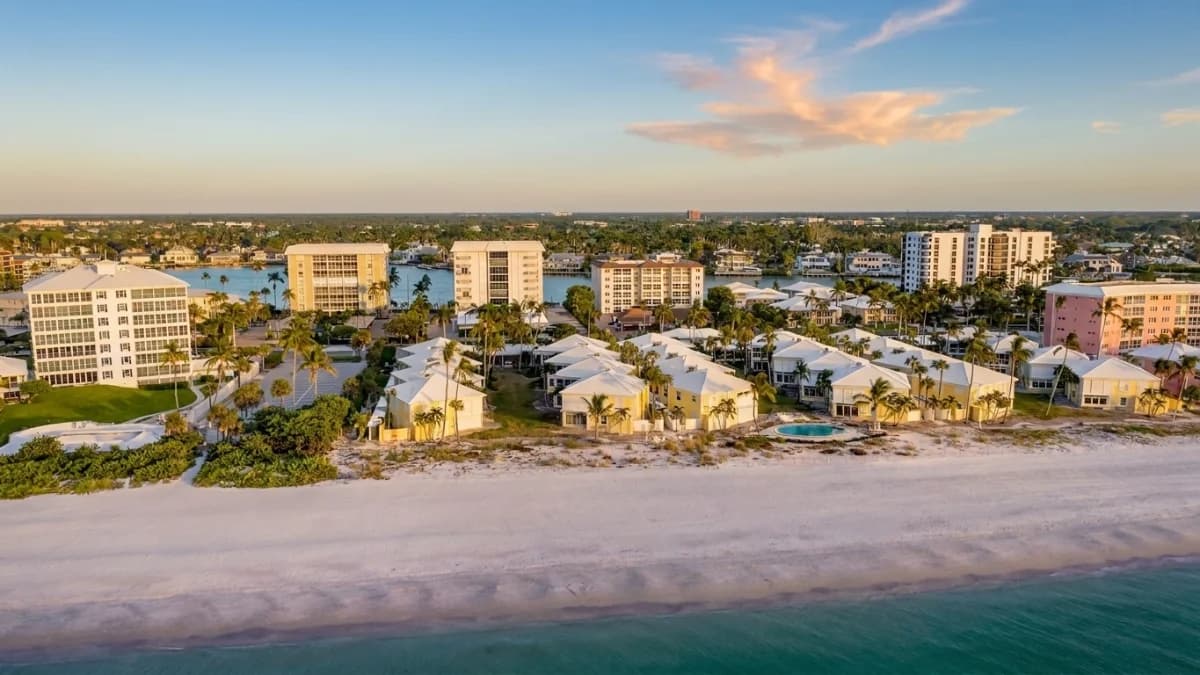
La Tour Rivage is a distinguished beachfront co-operative residence located in the exclusive Moorings section of Naples. Built in 1965 by Frank J. Rooney, Inc., this French colonial-designed building offers luxuriously casual living with an emphasis on quality construction and the tropical outdoor lifestyle.
Location & Setting
Situated at 1851 Gulf Shore Blvd N in one of Naples'' most desirable neighborhoods, La Tour Rivage provides residents with a prime beachfront location. The Moorings area is known for offering everything one desires for leisure living without the glitter of a resort atmosphere.
Building & Residences
This 6-story building contains 40 co-op units, each featuring approximately 1,100 square feet of living space. Every residence was designed to express the tropical outdoor life with large living areas that enhance movement. All units feature picture windows overlooking the Gulf, individual balconies, central air conditioning and heating with individual controls, and private covered garage parking.
Quality & Management
La Tour Rivage was constructed with Triple A custom construction using only the finest quality materials to ensure minimum monthly maintenance fees. The building features on-premise, full-time management to assist residents with all their needs.
Quick Facts
- Monthly Fees
- Co-op fees range from ≈$667 to $1,167/mo
- Community Type
- Waterfront / boating
- Gated
- No
- Residences
- 40 co-op units
- Location
- Naples Moorings
- Established
- 1965
- Lifestyle
- Beachfront co-op living
- Pet Policy
- No pets allowed
- Annual Fees
- $8,000 – $14,000
Properties for Sale
Market Snapshot
There were 2 condos for sale in La Tour Rivage (Moorings, Naples) in September 2026, up from 0 in September 2025, according to NABOR MLS data through September 2026. This level of inventory represents 2 months supply of condos in September 2026, compared to 0 months supply in September 2025. In April 2026, the median closed price for condos was $1,545,000, based on 1 closed sale. This is down from $1,790,000 in February 2025, also based on 1 closed sale. The median price per square foot for condos was $1,030 in April 2026. For total sales, there was 1 condo sale in April 2026. Pending sales for condos were 0 in September 2026.
October 2026 · Last updated Oct 2, 2026
Pricing
Track how home values are trending in La Tour Rivage. Median sale prices and price-per-square-foot data help buyers and sellers gauge current market positioning.
Median Closed Price
$1,545,000 as of April 2026.
View monthly data
| Month | Median Closed Price |
|---|---|
| March 2023 | $1,900,000 |
| February 2025 | $1,790,000 |
| April 2026 | $1,545,000 |
Source: Naples Area Board of REALTORS® (NABOR®) MLS, via InfoSparks. Data through April 2026. Data deemed reliable but not guaranteed.
Median Prices per Sq ft
$1,030 as of April 2026.
View monthly data
| Month | Median Prices per Sq ft |
|---|---|
| March 2023 | $1,687 |
| February 2025 | $1,570 |
| April 2026 | $1,030 |
Source: Naples Area Board of REALTORS® (NABOR®) MLS, via InfoSparks. Data through April 2026. Data deemed reliable but not guaranteed.
Median Closed Price
$1,545,000 as of April 2026.
View monthly data
| Month | Median Closed Price |
|---|---|
| March 2023 | $1,900,000 |
| February 2025 | $1,790,000 |
| April 2026 | $1,545,000 |
Source: Naples Area Board of REALTORS® (NABOR®) MLS, via InfoSparks. Data through April 2026. Data deemed reliable but not guaranteed.
$1,030 as of April 2026.
View monthly data
| Month | Median Prices per Sq ft |
|---|---|
| March 2023 | $1,687 |
| February 2025 | $1,570 |
| April 2026 | $1,030 |
Source: Naples Area Board of REALTORS® (NABOR®) MLS, via InfoSparks. Data through April 2026. Data deemed reliable but not guaranteed.
Inventory
See how many homes are available in La Tour Rivage and how quickly inventory is moving. Months of supply indicates whether conditions favor buyers or sellers.
Homes For Sale
2 as of September 2026.
View monthly data
| Month | Homes For Sale |
|---|---|
| October 2025 | 0 |
| November 2025 | 0 |
| December 2025 | 0 |
| January 2026 | 0 |
| February 2026 | 0 |
| March 2026 | 0 |
| April 2026 | 1 |
| May 2026 | 2 |
| June 2026 | 2 |
| July 2026 | 2 |
| August 2026 | 2 |
| September 2026 | 2 |
Source: Naples Area Board of REALTORS® (NABOR®) MLS, via InfoSparks. Data through September 2026. Data deemed reliable but not guaranteed.
Months Supply
2 as of September 2026.
View monthly data
| Month | Months Supply |
|---|---|
| January 2023 | 1 |
| April 2026 | 1 |
| May 2026 | 2 |
| June 2026 | 2 |
| July 2026 | 2 |
| August 2026 | 2 |
| September 2026 | 2 |
Source: Naples Area Board of REALTORS® (NABOR®) MLS, via InfoSparks. Data through September 2026. Data deemed reliable but not guaranteed.
Homes For Sale
2 as of September 2026.
View monthly data
| Month | Homes For Sale |
|---|---|
| October 2025 | 0 |
| November 2025 | 0 |
| December 2025 | 0 |
| January 2026 | 0 |
| February 2026 | 0 |
| March 2026 | 0 |
| April 2026 | 1 |
| May 2026 | 2 |
| June 2026 | 2 |
| July 2026 | 2 |
| August 2026 | 2 |
| September 2026 | 2 |
Source: Naples Area Board of REALTORS® (NABOR®) MLS, via InfoSparks. Data through September 2026. Data deemed reliable but not guaranteed.
2 as of September 2026.
View monthly data
| Month | Months Supply |
|---|---|
| January 2023 | 1 |
| April 2026 | 1 |
| May 2026 | 2 |
| June 2026 | 2 |
| July 2026 | 2 |
| August 2026 | 2 |
| September 2026 | 2 |
Source: Naples Area Board of REALTORS® (NABOR®) MLS, via InfoSparks. Data through September 2026. Data deemed reliable but not guaranteed.
Activity
Monitor real estate transaction volume in La Tour Rivage. Pending and closed sales reflect the pace of buyer demand and overall market momentum.
Pending Sales
0 as of September 2026.
View monthly data
| Month | Pending Sales |
|---|---|
| October 2025 | 0 |
| November 2025 | 0 |
| December 2025 | 0 |
| January 2026 | 0 |
| February 2026 | 0 |
| March 2026 | 0 |
| April 2026 | 1 |
| May 2026 | 0 |
| June 2026 | 0 |
| July 2026 | 0 |
| August 2026 | 0 |
| September 2026 | 0 |
Source: Naples Area Board of REALTORS® (NABOR®) MLS, via InfoSparks. Data through September 2026. Data deemed reliable but not guaranteed.
Total Sales
0 as of September 2026.
View monthly data
| Month | Total Sales |
|---|---|
| October 2025 | 0 |
| November 2025 | 0 |
| December 2025 | 0 |
| January 2026 | 0 |
| February 2026 | 0 |
| March 2026 | 0 |
| April 2026 | 1 |
| May 2026 | 0 |
| June 2026 | 0 |
| July 2026 | 0 |
| August 2026 | 0 |
| September 2026 | 0 |
Source: Naples Area Board of REALTORS® (NABOR®) MLS, via InfoSparks. Data through September 2026. Data deemed reliable but not guaranteed.
Pending Sales
0 as of September 2026.
View monthly data
| Month | Pending Sales |
|---|---|
| October 2025 | 0 |
| November 2025 | 0 |
| December 2025 | 0 |
| January 2026 | 0 |
| February 2026 | 0 |
| March 2026 | 0 |
| April 2026 | 1 |
| May 2026 | 0 |
| June 2026 | 0 |
| July 2026 | 0 |
| August 2026 | 0 |
| September 2026 | 0 |
Source: Naples Area Board of REALTORS® (NABOR®) MLS, via InfoSparks. Data through September 2026. Data deemed reliable but not guaranteed.
0 as of September 2026.
View monthly data
| Month | Total Sales |
|---|---|
| October 2025 | 0 |
| November 2025 | 0 |
| December 2025 | 0 |
| January 2026 | 0 |
| February 2026 | 0 |
| March 2026 | 0 |
| April 2026 | 1 |
| May 2026 | 0 |
| June 2026 | 0 |
| July 2026 | 0 |
| August 2026 | 0 |
| September 2026 | 0 |
Source: Naples Area Board of REALTORS® (NABOR®) MLS, via InfoSparks. Data through September 2026. Data deemed reliable but not guaranteed.