Lbuilding
Naples • Park Shore
Le Jardin
Luxury beachfront condominium in Park Shore with spacious residences and Gulf views.
Gated
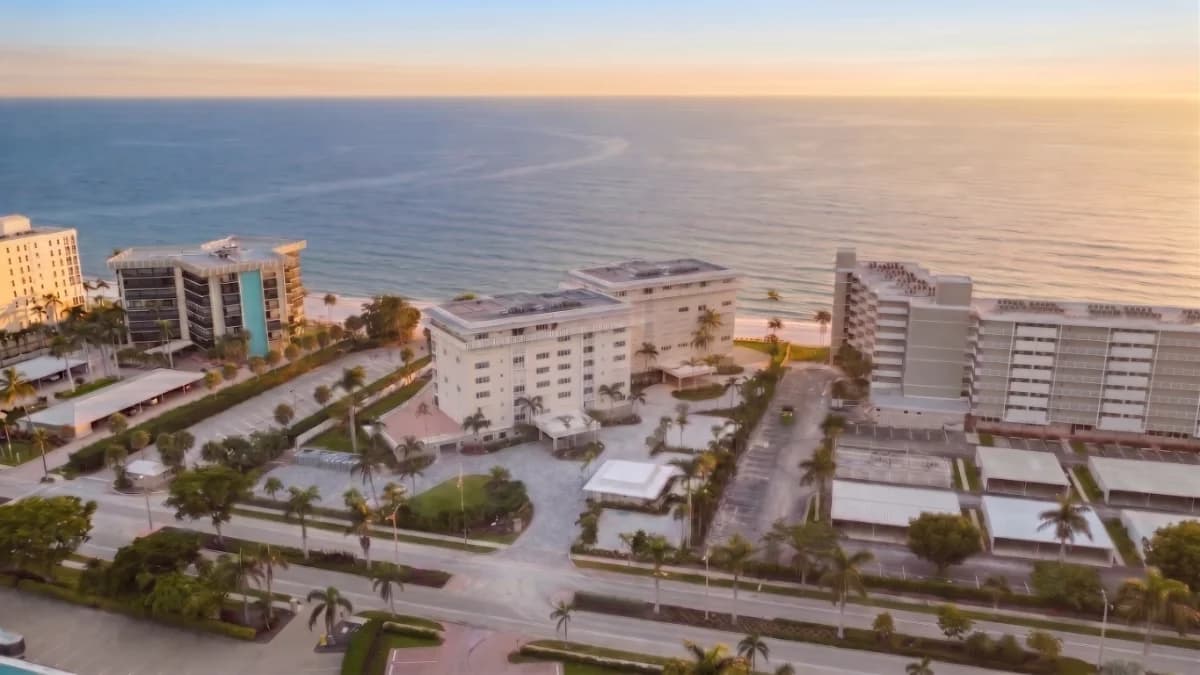
Regency Towers is a distinguished beachfront cooperative community located on picturesque Gulf Shore Boulevard North in the Moorings area of Naples. Since the 1970s, this premier community has offered luxury living with direct beach access and stunning Gulf of Mexico views.
Situated between Vedado Beach and Venetian Bay, Regency Towers enjoys one of the most coveted locations in Naples. The property features southwestern exposure to warm turquoise waters, white crystalline sands, and spectacular Gulf sunsets. Residents can walk to the fine dining and shopping boutiques of nearby Venetian Village.
The community consists of two eight-story towers with twenty units each, totaling 40 luxury cooperative condominiums. Units range from 1,942 to 3,080 square feet and feature spacious lanais overlooking the beachside pool and manicured landscape. Built after Hurricane Donna with double code standards, the buildings offer exceptional durability and construction quality.
Regency Towers provides resort-style amenities including a beachside pool, spa, renovated fitness room, community social room, and undercover barbecue area. The property features 24-hour management, an updated security system, under-building parking, and individual unit storage lockers. Recent renovations have enhanced the social room, lobbies, fitness facilities, and pool areas while maintaining the classic character of this unique property.
As a cooperative community, Regency Towers maintains an exclusive residential atmosphere with no rental or pet policies. The beachfront location provides direct access to the Gulf of Mexico, with the adjacent Vedado beach access point offering additional privacy and enhanced views for residents.
Here's a summary of the Regency Towers (Moorings, Naples) real estate market through April 2026. The median sales price for condos in Regency Towers has seen some fluctuation. In April 2026, it stood at $2,550,000, down from $1,650,000 in March 2026. Inventory levels in Regency Towers, consisting of condos, show 3 homes for sale as of April 2026. This is down from 4 in March 2026 and 5 in February 2026. The months' supply of homes for sale was 2.4 in April 2026, a decrease from 4 in March 2026. Sales activity in Regency Towers has seen some recent movement. There was 1 pending sale in both March and April 2026, up from 0 in January 2026. Total sales in April 2026 were 2, up from 1 in March 2026. The median price per square foot for condos was $973 in April 2026 compared to $712 in March 2026.
May 2026 · Last updated May 2, 2026
Track how home values are trending in Regency Towers. Median sale prices and price-per-square-foot data help buyers and sellers gauge current market positioning.
Median Closed Price
$2,550,000 as of April 2026.
| Month | Median Closed Price |
|---|---|
| August 2023 | $1,825,000 |
| May 2024 | $1,995,000 |
| June 2024 | $2,730,000 |
| January 2025 | $2,760,000 |
| April 2025 | $4,200,000 |
| May 2025 | $2,200,000 |
| September 2025 | $2,600,000 |
| March 2026 | $1,650,000 |
| April 2026 | $2,550,000 |
Source: Naples Area Board of REALTORS® (NABOR®) MLS, via InfoSparks. Data through April 2026. Data deemed reliable but not guaranteed.
Median Prices per Sq ft
$1,003 as of June 2026.
| Month | Median Prices per Sq ft |
|---|---|
| August 2023 | $870 |
| May 2024 | $1,027 |
| June 2024 | $1,588 |
| January 2025 | $1,192 |
| April 2025 | $1,364 |
| May 2025 | $1,280 |
| September 2025 | $1,240 |
| March 2026 | $712 |
| April 2026 | $973 |
| June 2026 | $1,003 |
Source: Naples Area Board of REALTORS® (NABOR®) MLS, via InfoSparks. Data through June 2026. Data deemed reliable but not guaranteed.
Median Closed Price
$2,550,000 as of April 2026.
| Month | Median Closed Price |
|---|---|
| August 2023 | $1,825,000 |
| May 2024 | $1,995,000 |
| June 2024 | $2,730,000 |
| January 2025 | $2,760,000 |
| April 2025 | $4,200,000 |
| May 2025 | $2,200,000 |
| September 2025 | $2,600,000 |
| March 2026 | $1,650,000 |
| April 2026 | $2,550,000 |
Source: Naples Area Board of REALTORS® (NABOR®) MLS, via InfoSparks. Data through April 2026. Data deemed reliable but not guaranteed.
$1,003 as of June 2026.
| Month | Median Prices per Sq ft |
|---|---|
| August 2023 | $870 |
| May 2024 | $1,027 |
| June 2024 | $1,588 |
| January 2025 | $1,192 |
| April 2025 | $1,364 |
| May 2025 | $1,280 |
| September 2025 | $1,240 |
| March 2026 | $712 |
| April 2026 | $973 |
| June 2026 | $1,003 |
Source: Naples Area Board of REALTORS® (NABOR®) MLS, via InfoSparks. Data through June 2026. Data deemed reliable but not guaranteed.
See how many homes are available in Regency Towers and how quickly inventory is moving. Months of supply indicates whether conditions favor buyers or sellers.
Homes For Sale
1 as of May 2026, down 87.5% year-over-year.
| Month | Homes For Sale |
|---|---|
| June 2025 | 4 |
| July 2025 | 5 |
| August 2025 | 3 |
| September 2025 | 3 |
| October 2025 | 4 |
| November 2025 | 7 |
| December 2025 | 6 |
| January 2026 | 7 |
| February 2026 | 5 |
| March 2026 | 4 |
| April 2026 | 3 |
| May 2026 | 1 |
Source: Naples Area Board of REALTORS® (NABOR®) MLS, via InfoSparks. Data through May 2026. Data deemed reliable but not guaranteed.
Months Supply
0.8 as of June 2026, down 80.0% year-over-year.
| Month | Months Supply |
|---|---|
| July 2025 | 5 |
| August 2025 | 3 |
| September 2025 | 3 |
| October 2025 | 4 |
| November 2025 | 7 |
| December 2025 | 6 |
| January 2026 | 7 |
| February 2026 | 5 |
| March 2026 | 4 |
| April 2026 | 2.4 |
| May 2026 | 0.8 |
| June 2026 | 0.8 |
Source: Naples Area Board of REALTORS® (NABOR®) MLS, via InfoSparks. Data through June 2026. Data deemed reliable but not guaranteed.
Homes For Sale
1 as of May 2026, down 87.5% year-over-year.
| Month | Homes For Sale |
|---|---|
| June 2025 | 4 |
| July 2025 | 5 |
| August 2025 | 3 |
| September 2025 | 3 |
| October 2025 | 4 |
| November 2025 | 7 |
| December 2025 | 6 |
| January 2026 | 7 |
| February 2026 | 5 |
| March 2026 | 4 |
| April 2026 | 3 |
| May 2026 | 1 |
Source: Naples Area Board of REALTORS® (NABOR®) MLS, via InfoSparks. Data through May 2026. Data deemed reliable but not guaranteed.
0.8 as of June 2026, down 80.0% year-over-year.
| Month | Months Supply |
|---|---|
| July 2025 | 5 |
| August 2025 | 3 |
| September 2025 | 3 |
| October 2025 | 4 |
| November 2025 | 7 |
| December 2025 | 6 |
| January 2026 | 7 |
| February 2026 | 5 |
| March 2026 | 4 |
| April 2026 | 2.4 |
| May 2026 | 0.8 |
| June 2026 | 0.8 |
Source: Naples Area Board of REALTORS® (NABOR®) MLS, via InfoSparks. Data through June 2026. Data deemed reliable but not guaranteed.
Monitor real estate transaction volume in Regency Towers. Pending and closed sales reflect the pace of buyer demand and overall market momentum.
Pending Sales
0 as of June 2026.
| Month | Pending Sales |
|---|---|
| July 2025 | 0 |
| August 2025 | 1 |
| September 2025 | 0 |
| October 2025 | 0 |
| November 2025 | 0 |
| December 2025 | 0 |
| January 2026 | 0 |
| February 2026 | 2 |
| March 2026 | 1 |
| April 2026 | 1 |
| May 2026 | 0 |
| June 2026 | 0 |
Source: Naples Area Board of REALTORS® (NABOR®) MLS, via InfoSparks. Data through June 2026. Data deemed reliable but not guaranteed.
Total Sales
1 as of June 2026.
| Month | Total Sales |
|---|---|
| July 2025 | 0 |
| August 2025 | 0 |
| September 2025 | 1 |
| October 2025 | 0 |
| November 2025 | 0 |
| December 2025 | 0 |
| January 2026 | 0 |
| February 2026 | 0 |
| March 2026 | 1 |
| April 2026 | 2 |
| May 2026 | 0 |
| June 2026 | 1 |
Source: Naples Area Board of REALTORS® (NABOR®) MLS, via InfoSparks. Data through June 2026. Data deemed reliable but not guaranteed.
Pending Sales
0 as of June 2026.
| Month | Pending Sales |
|---|---|
| July 2025 | 0 |
| August 2025 | 1 |
| September 2025 | 0 |
| October 2025 | 0 |
| November 2025 | 0 |
| December 2025 | 0 |
| January 2026 | 0 |
| February 2026 | 2 |
| March 2026 | 1 |
| April 2026 | 1 |
| May 2026 | 0 |
| June 2026 | 0 |
Source: Naples Area Board of REALTORS® (NABOR®) MLS, via InfoSparks. Data through June 2026. Data deemed reliable but not guaranteed.
1 as of June 2026.
| Month | Total Sales |
|---|---|
| July 2025 | 0 |
| August 2025 | 0 |
| September 2025 | 1 |
| October 2025 | 0 |
| November 2025 | 0 |
| December 2025 | 0 |
| January 2026 | 0 |
| February 2026 | 0 |
| March 2026 | 1 |
| April 2026 | 2 |
| May 2026 | 0 |
| June 2026 | 1 |
Source: Naples Area Board of REALTORS® (NABOR®) MLS, via InfoSparks. Data through June 2026. Data deemed reliable but not guaranteed.
Luxury beachfront condominium in Park Shore with spacious residences and Gulf views.
 building
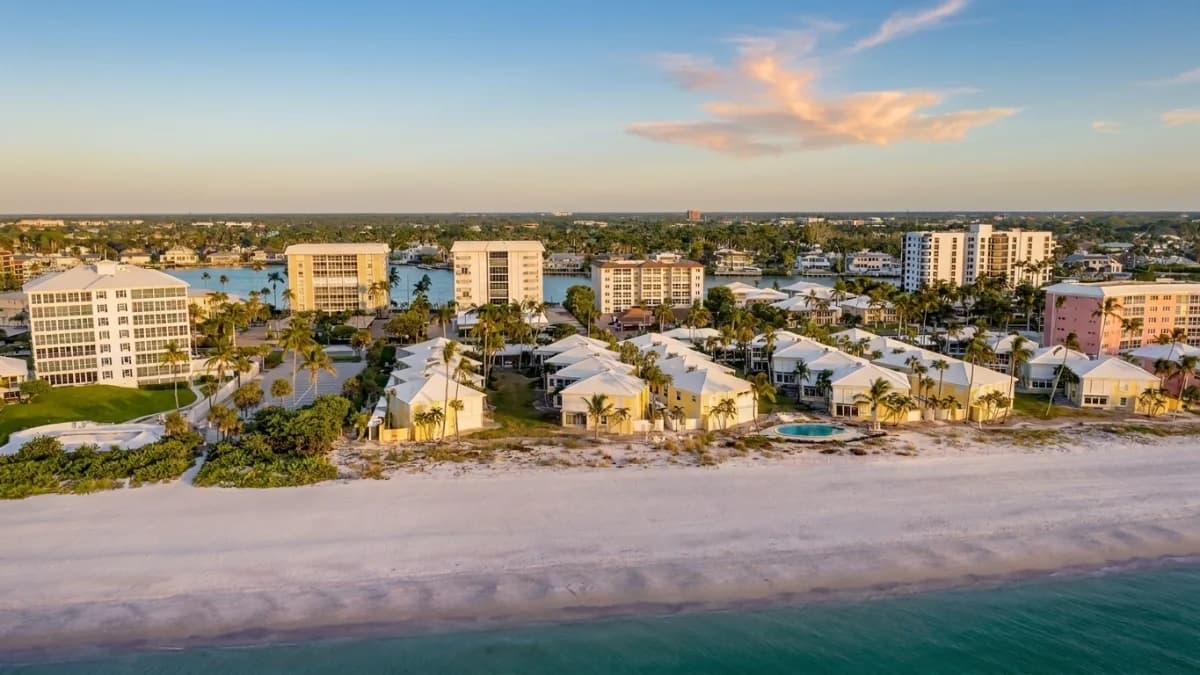
Beachfront cooperative community in The Moorings with 48 residences across four low-rise buildings.
Exclusive beachfront cooperative in Moorings with 33 residences, built in 1971, offering private beach access and luxury coastal living.
Luxury beachfront condominium in Park Shore with spacious residences and Gulf views.
buildingBeachfront cooperative community in The Moorings with 48 residences across four low-rise buildings.
Exclusive beachfront cooperative in Moorings with 33 residences, built in 1971, offering private beach access and luxury coastal living.
 location
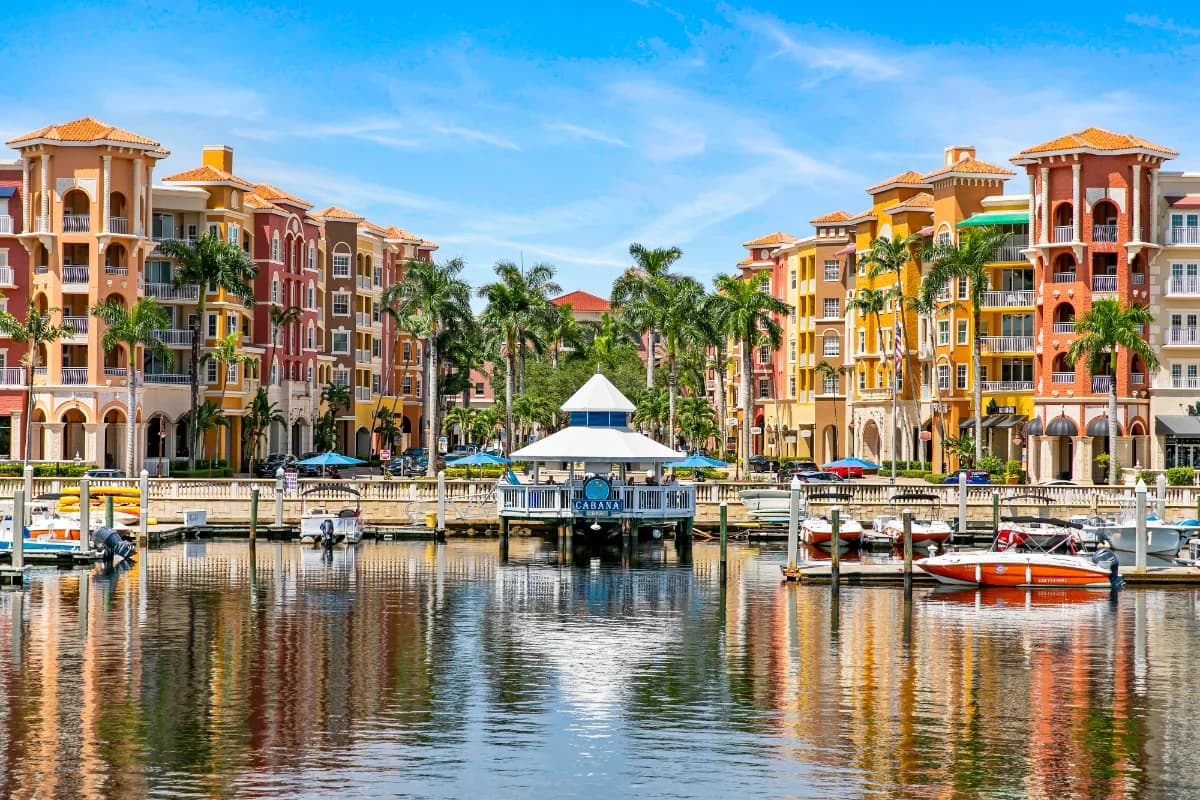
World-class beaches, golf, and coastal lifestyle in Southwest Florida.
 area
area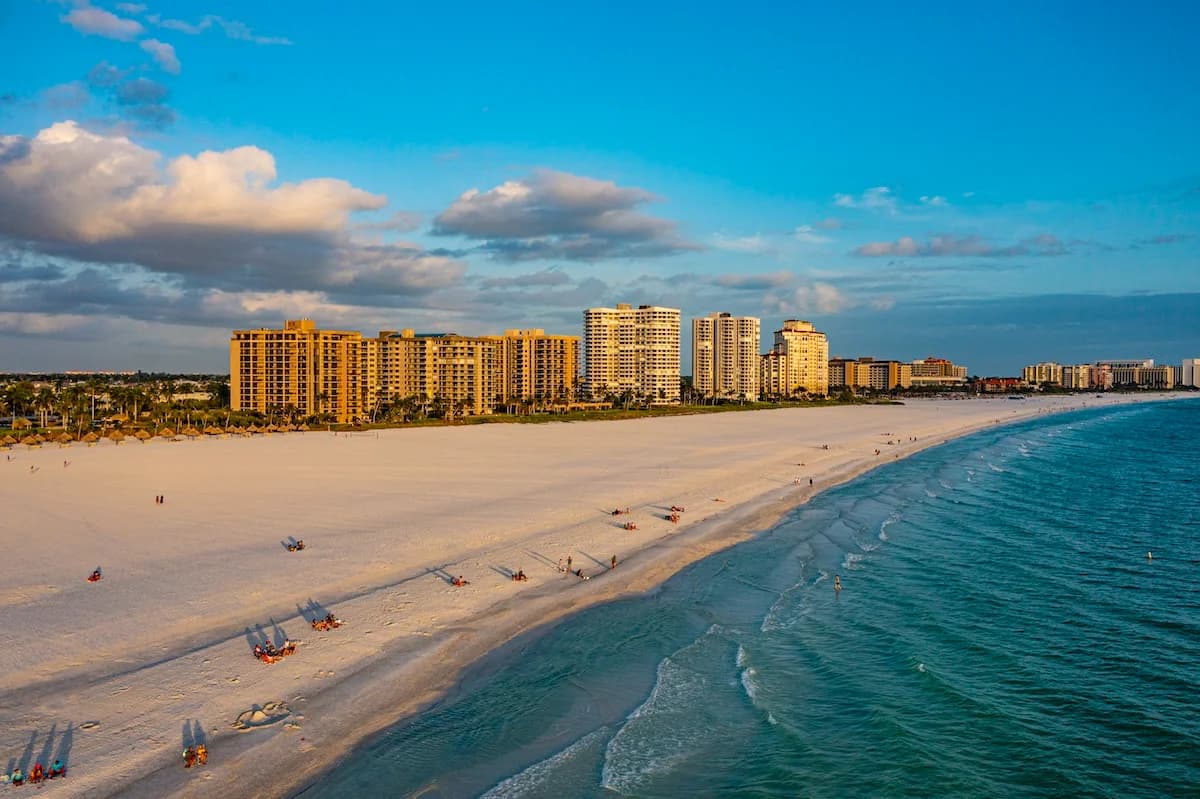 location
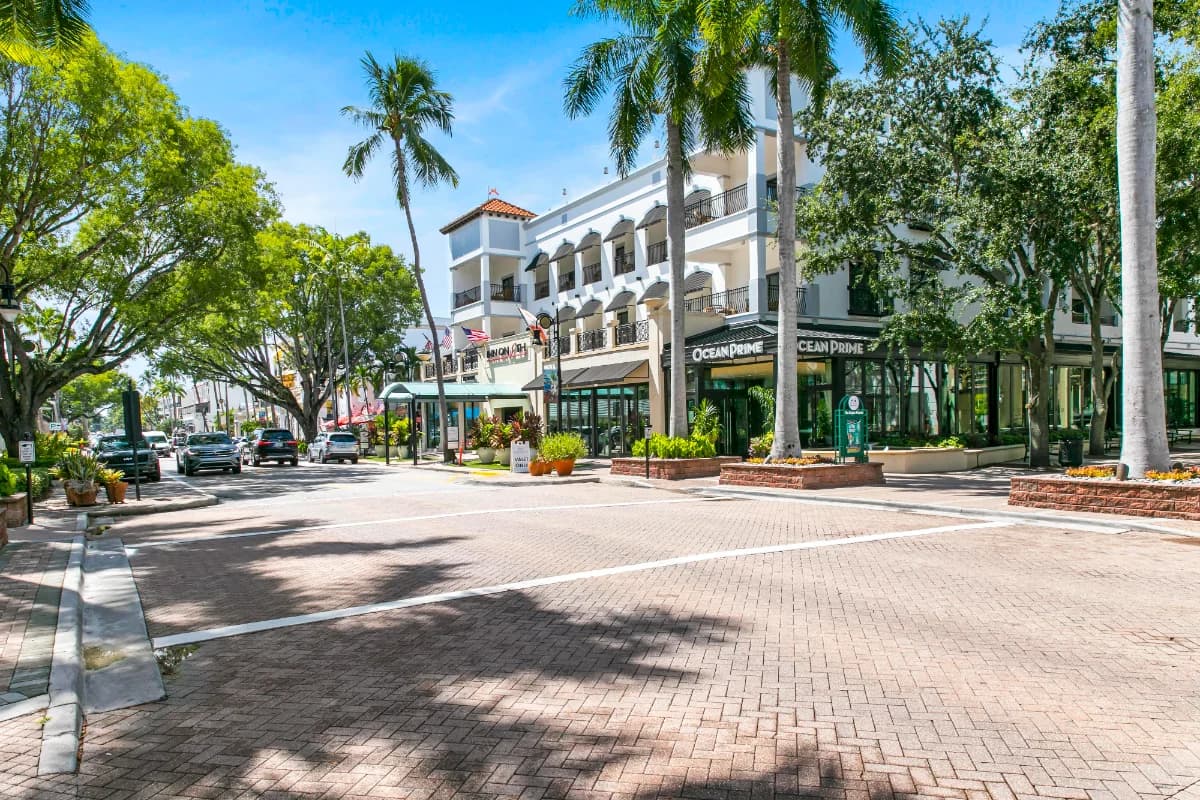
Island living with white-sand beaches and boating lifestyle.
locationWorld-class beaches, golf, and coastal lifestyle in Southwest Florida.
arealocationIsland living with white-sand beaches and boating lifestyle.