Stonebridge Country Club
Gated · High $300,000s – $1.8M
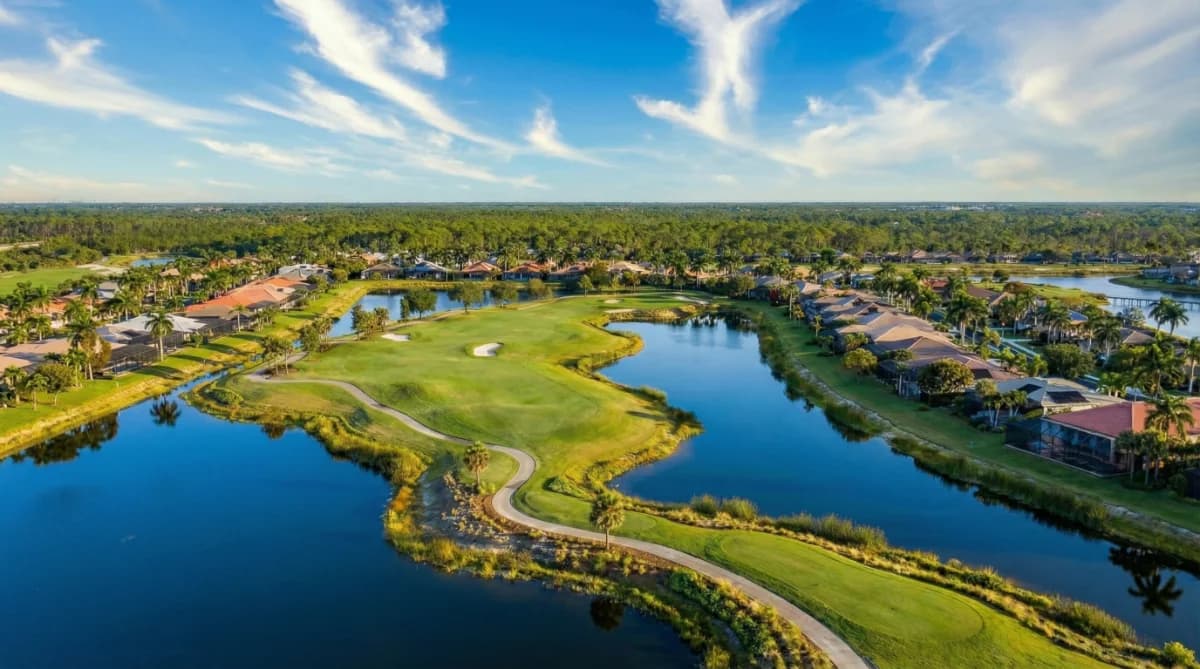
Stonebridge Country Club is 799 homes across ten neighborhoods on about 313 acres of North Naples, behind a gatehouse the club describes as guarded twenty-four hours. Building ran from 1995 to 2002 and stopped there, so the only way in is a resale. One corporation runs both the neighborhood association and the country club, so everything the club does sits in its operating fund: golf, dining, tennis, the pool, the fitness center. There is no separate club company, and nothing here to join separately from the association.
That structure is the thing to understand before making an offer, because membership isn't optional and can't be bought separately. Every owner is a member, the club sells no equity share, and it holds no refundable deposit. The membership page is exact about that: "There are no equity or deposits required to become a member. The value of the home includes the value of the club membership." That does not mean a buyer reaches the closing table with nothing to pay.
What does a buyer pay at closing?
One capital contribution to the association, charged once and separate from the price you negotiate. The association's rates schedule names it the New Owner Capital Contribution Fee, under a heading that reads "(Payable at closing to SCCCA)". The new owner pays it, at closing, to the association, and a membership transfer fee and an estoppel fee arrive alongside.
An owner already living in Stonebridge who moves to another home inside the gates pays less. Under the schedule in force, that owner pays nothing at all on the contribution. The association's board decides the amount, and it has jumped more than once. Ask for the New Owner Capital Contribution Fee by name, for the fiscal year the sale will close in, so nobody quotes you the transfer fee instead.
Who bills a home at Stonebridge?
Ten separate bodies, working to two different fiscal calendars. The association charges quarterly residential dues that bundle the country club dues, the master assessment, master capital reserves, a clubhouse renovation charge, a food-and-beverage service charge and a strategic reserve. Each home is then charged for its own neighborhood, and that second bill comes from somewhere else. The association bills the four single-family neighborhoods itself, while outside management companies bill the six condominium associations. Those companies work to a calendar year, and the association's own year runs October to September.
The neighborhood charge is no formality. It's a second four-figure annual sum, and it differs by neighborhood. In at least one of the single-family neighborhoods it varies from one lot to the next. Compare two homes here and you are comparing two different totals. On the single-family lots the association maintains lawns and landscaping and bills it back, which is why those neighborhoods carry a maintenance charge of their own alongside the dues.
What kind of homes are here?
Six of the ten neighborhoods are condominium associations: Ashton Oaks, Braeburn, Carrington, Heatherwood, Middleburg and Willow Bend. The other four are single-family, and they are Hawthorne Estates, Manchester, Shoreham and Thornbrooke. Of the 799 homes, 548 are held as condominium units and 251 sit on single-family lots. That split describes legal tenure, not what a building looks like. The club's own list of built forms runs to "ten diverse neighborhoods including garden homes, coach homes, attached and detached villas and single-family estate homes."
So the label on a listing doesn't settle which association bills a home, or who maintains the outside of it. Ask. Sizes run from about 1,180 to about 4,480 square feet across the ten neighborhoods.
What have homes sold for?
Three bands rather than one, and they follow the neighborhood:
- Carrington, Heatherwood and Willow Bend. Sold from the top of the $300,000s into the middle of the $500,000s.
- Braeburn, Ashton Oaks and Middleburg. Sold across the $600,000s, the $700,000s and the $800,000s.
- The single-family lots. Sold from around $900,000, and the largest have reached around $1.8 million.
Southampton belongs to Stonebridge rather than sitting beside it, which matters if a listing names it and not the community. Its 46 homes are inside the gates, under the same association and the same club, and the clubhouse at 2100 Winding Oaks Way stands on Southampton ground.
What is the golf course like?
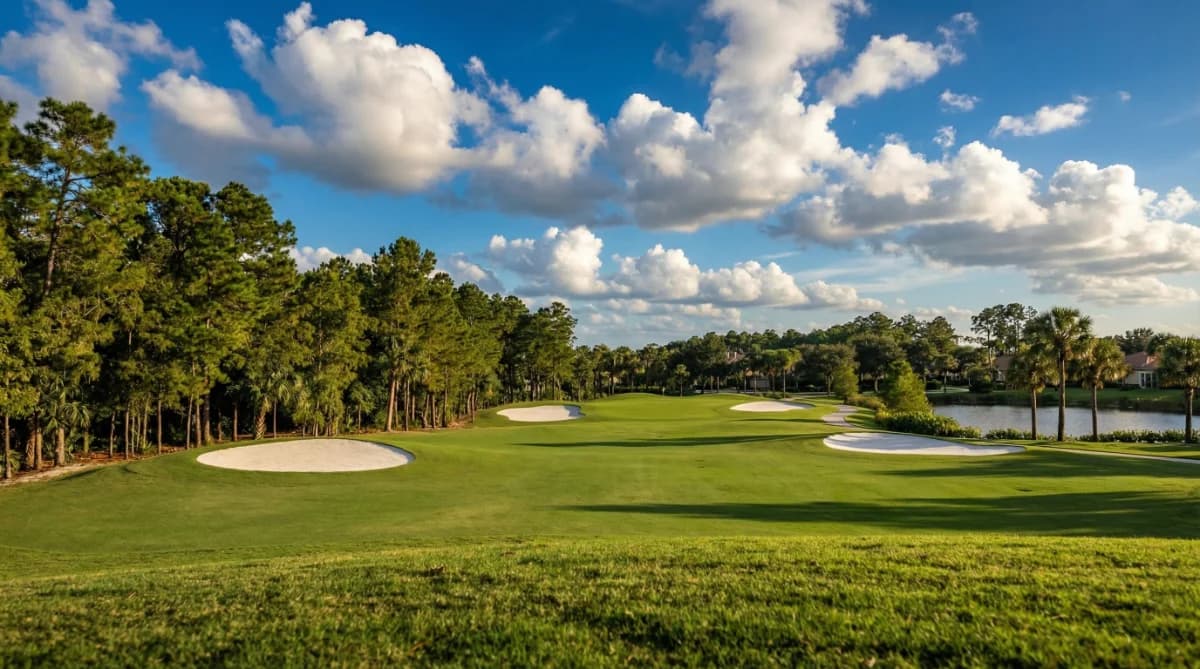
Par 71, with water in play on 15 of the 18 holes. Each hole gives a choice of tees. The layout has been redesigned twice since the homes went up, the later of the two finished in 2023, so an older account of how a hole plays is worth ignoring.
What else is inside the gate?
Tennis runs on five Har-Tru courts, open 8:00am to 10:00pm daily, and the clubhouse holds several dining venues. The fitness center was expanded and redesigned during the 2014 round of clubhouse work, and the clubhouse has been renovated again since. A two-mile loop runs around the community for walking, jogging and biking, past the same freshwater lakes the course plays over. All of it sits in unincorporated Collier County, inside the North Collier fire district.
Gene Bates of Couples Bates Golf Design drew the first version of this course, Gordon Lewis the second in 2010, and Kip Schulties the third. Every one of the 799 homes was finished before the second version opened.
Quick Facts
- Home Prices
- High $300,000s – $1.8M
- Initiation Fee
- Capital contribution due at closing
- Community Type
- Bundled golf community, Club membership required
- Gated
- Yes
- Residences
- 799 homes in ten neighborhoods
- Location
- North Naples, unincorporated Collier County
- Golf
- Par 71; water on 15 of 18 holes; redesigned 2010 and 2023
- Home Sizes
- 1,180–4,480 sq ft
- Bedrooms
- 2–4
- Built
- 1995 to 2002
Properties for Sale
Market Snapshot
The median closed price in Stonebridge Country Club, North Naples was $440,000 in September 2026, down 68% from $1,375,000 a year earlier, according to NABOR MLS data through September 2026. The median price per square foot for all property types was $276 in September 2026, compared to $577 in September 2025. For condos specifically, the median closed price was $440,000 in September 2026, down from $650,000 in August 2025. There was only one single family home sale in September 2025, and no single family home sales in September 2026. Inventory in Stonebridge Country Club saw a decrease in September 2026, with 8 homes for sale across all property types, down from 12 in August 2026. The months supply of homes for sale for all property types in September 2026 was 2.8 months, indicating a decrease in available housing compared to 4.1 months in August 2026. Condo inventory in September 2026 was 7 units, leading to a months supply of 3.2 months for condos. Sales activity in Stonebridge Country Club shows a single total sale in September 2026, which was a condo. This is similar to September 2025, which also saw 2 total sales, with 2 single-family homes and no condo sales. One pending sale was recorded in September 2026, a single-family home. This compares to three pending condo sales in September 2025.
October 2026 · Last updated Oct 2, 2026
Pricing
Track how home values are trending in Stonebridge Country Club. Median sale prices and price-per-square-foot data help buyers and sellers gauge current market positioning.
Median Closed Price
$440,000 as of September 2026, down 68.0% year-over-year.
View monthly data
| Month | Median Closed Price |
|---|---|
| October 2025 | $727,000 |
| November 2025 | $504,500 |
| December 2025 | $410,000 |
| January 2026 | $782,500 |
| February 2026 | $415,000 |
| March 2026 | $437,500 |
| April 2026 | $693,500 |
| May 2026 | $430,000 |
| June 2026 | $710,000 |
| July 2026 | $565,000 |
| August 2026 | $475,000 |
| September 2026 | $440,000 |
Source: Naples Area Board of REALTORS® (NABOR®) MLS, via InfoSparks. Data through September 2026. Data deemed reliable but not guaranteed.
Median Prices per Sq ft
$276 as of September 2026, down 52.2% year-over-year.
View monthly data
| Month | Median Prices per Sq ft |
|---|---|
| October 2025 | $361 |
| November 2025 | $336 |
| December 2025 | $338 |
| January 2026 | $441 |
| February 2026 | $265 |
| March 2026 | $321 |
| April 2026 | $345 |
| May 2026 | $283 |
| June 2026 | $375 |
| July 2026 | $365 |
| August 2026 | $298 |
| September 2026 | $276 |
Source: Naples Area Board of REALTORS® (NABOR®) MLS, via InfoSparks. Data through September 2026. Data deemed reliable but not guaranteed.
Median Closed Price
$440,000 as of September 2026, down 68.0% year-over-year.
View monthly data
| Month | Median Closed Price |
|---|---|
| October 2025 | $727,000 |
| November 2025 | $504,500 |
| December 2025 | $410,000 |
| January 2026 | $782,500 |
| February 2026 | $415,000 |
| March 2026 | $437,500 |
| April 2026 | $693,500 |
| May 2026 | $430,000 |
| June 2026 | $710,000 |
| July 2026 | $565,000 |
| August 2026 | $475,000 |
| September 2026 | $440,000 |
Source: Naples Area Board of REALTORS® (NABOR®) MLS, via InfoSparks. Data through September 2026. Data deemed reliable but not guaranteed.
$276 as of September 2026, down 52.2% year-over-year.
View monthly data
| Month | Median Prices per Sq ft |
|---|---|
| October 2025 | $361 |
| November 2025 | $336 |
| December 2025 | $338 |
| January 2026 | $441 |
| February 2026 | $265 |
| March 2026 | $321 |
| April 2026 | $345 |
| May 2026 | $283 |
| June 2026 | $375 |
| July 2026 | $365 |
| August 2026 | $298 |
| September 2026 | $276 |
Source: Naples Area Board of REALTORS® (NABOR®) MLS, via InfoSparks. Data through September 2026. Data deemed reliable but not guaranteed.
Inventory
See how many homes are available in Stonebridge Country Club and how quickly inventory is moving. Months of supply indicates whether conditions favor buyers or sellers.
Homes For Sale
9 as of September 2026, up 80.0% year-over-year.
View monthly data
| Month | Homes For Sale |
|---|---|
| October 2025 | 9 |
| November 2025 | 7 |
| December 2025 | 5 |
| January 2026 | 11 |
| February 2026 | 12 |
| March 2026 | 14 |
| April 2026 | 15 |
| May 2026 | 17 |
| June 2026 | 15 |
| July 2026 | 14 |
| August 2026 | 13 |
| September 2026 | 9 |
Source: Naples Area Board of REALTORS® (NABOR®) MLS, via InfoSparks. Data through September 2026. Data deemed reliable but not guaranteed.
Months Supply
3.2 as of September 2026, up 113.3% year-over-year.
View monthly data
| Month | Months Supply |
|---|---|
| October 2025 | 2.4 |
| November 2025 | 1.9 |
| December 2025 | 1.3 |
| January 2026 | 2.9 |
| February 2026 | 3.4 |
| March 2026 | 3.8 |
| April 2026 | 4.2 |
| May 2026 | 5.2 |
| June 2026 | 4.7 |
| July 2026 | 4.4 |
| August 2026 | 4.5 |
| September 2026 | 3.2 |
Source: Naples Area Board of REALTORS® (NABOR®) MLS, via InfoSparks. Data through September 2026. Data deemed reliable but not guaranteed.
Homes For Sale
9 as of September 2026, up 80.0% year-over-year.
View monthly data
| Month | Homes For Sale |
|---|---|
| October 2025 | 9 |
| November 2025 | 7 |
| December 2025 | 5 |
| January 2026 | 11 |
| February 2026 | 12 |
| March 2026 | 14 |
| April 2026 | 15 |
| May 2026 | 17 |
| June 2026 | 15 |
| July 2026 | 14 |
| August 2026 | 13 |
| September 2026 | 9 |
Source: Naples Area Board of REALTORS® (NABOR®) MLS, via InfoSparks. Data through September 2026. Data deemed reliable but not guaranteed.
3.2 as of September 2026, up 113.3% year-over-year.
View monthly data
| Month | Months Supply |
|---|---|
| October 2025 | 2.4 |
| November 2025 | 1.9 |
| December 2025 | 1.3 |
| January 2026 | 2.9 |
| February 2026 | 3.4 |
| March 2026 | 3.8 |
| April 2026 | 4.2 |
| May 2026 | 5.2 |
| June 2026 | 4.7 |
| July 2026 | 4.4 |
| August 2026 | 4.5 |
| September 2026 | 3.2 |
Source: Naples Area Board of REALTORS® (NABOR®) MLS, via InfoSparks. Data through September 2026. Data deemed reliable but not guaranteed.
Activity
Monitor real estate transaction volume in Stonebridge Country Club. Pending and closed sales reflect the pace of buyer demand and overall market momentum.
Pending Sales
1 as of September 2026, down 66.7% year-over-year.
View monthly data
| Month | Pending Sales |
|---|---|
| October 2025 | 5 |
| November 2025 | 3 |
| December 2025 | 1 |
| January 2026 | 3 |
| February 2026 | 7 |
| March 2026 | 2 |
| April 2026 | 3 |
| May 2026 | 2 |
| June 2026 | 1 |
| July 2026 | 1 |
| August 2026 | 1 |
| September 2026 | 1 |
Source: Naples Area Board of REALTORS® (NABOR®) MLS, via InfoSparks. Data through September 2026. Data deemed reliable but not guaranteed.
Total Sales
1 as of September 2026, down 50.0% year-over-year.
View monthly data
| Month | Total Sales |
|---|---|
| October 2025 | 6 |
| November 2025 | 1 |
| December 2025 | 5 |
| January 2026 | 2 |
| February 2026 | 1 |
| March 2026 | 7 |
| April 2026 | 4 |
| May 2026 | 3 |
| June 2026 | 1 |
| July 2026 | 2 |
| August 2026 | 1 |
| September 2026 | 1 |
Source: Naples Area Board of REALTORS® (NABOR®) MLS, via InfoSparks. Data through September 2026. Data deemed reliable but not guaranteed.
Pending Sales
1 as of September 2026, down 66.7% year-over-year.
View monthly data
| Month | Pending Sales |
|---|---|
| October 2025 | 5 |
| November 2025 | 3 |
| December 2025 | 1 |
| January 2026 | 3 |
| February 2026 | 7 |
| March 2026 | 2 |
| April 2026 | 3 |
| May 2026 | 2 |
| June 2026 | 1 |
| July 2026 | 1 |
| August 2026 | 1 |
| September 2026 | 1 |
Source: Naples Area Board of REALTORS® (NABOR®) MLS, via InfoSparks. Data through September 2026. Data deemed reliable but not guaranteed.
1 as of September 2026, down 50.0% year-over-year.
View monthly data
| Month | Total Sales |
|---|---|
| October 2025 | 6 |
| November 2025 | 1 |
| December 2025 | 5 |
| January 2026 | 2 |
| February 2026 | 1 |
| March 2026 | 7 |
| April 2026 | 4 |
| May 2026 | 3 |
| June 2026 | 1 |
| July 2026 | 2 |
| August 2026 | 1 |
| September 2026 | 1 |
Source: Naples Area Board of REALTORS® (NABOR®) MLS, via InfoSparks. Data through September 2026. Data deemed reliable but not guaranteed.