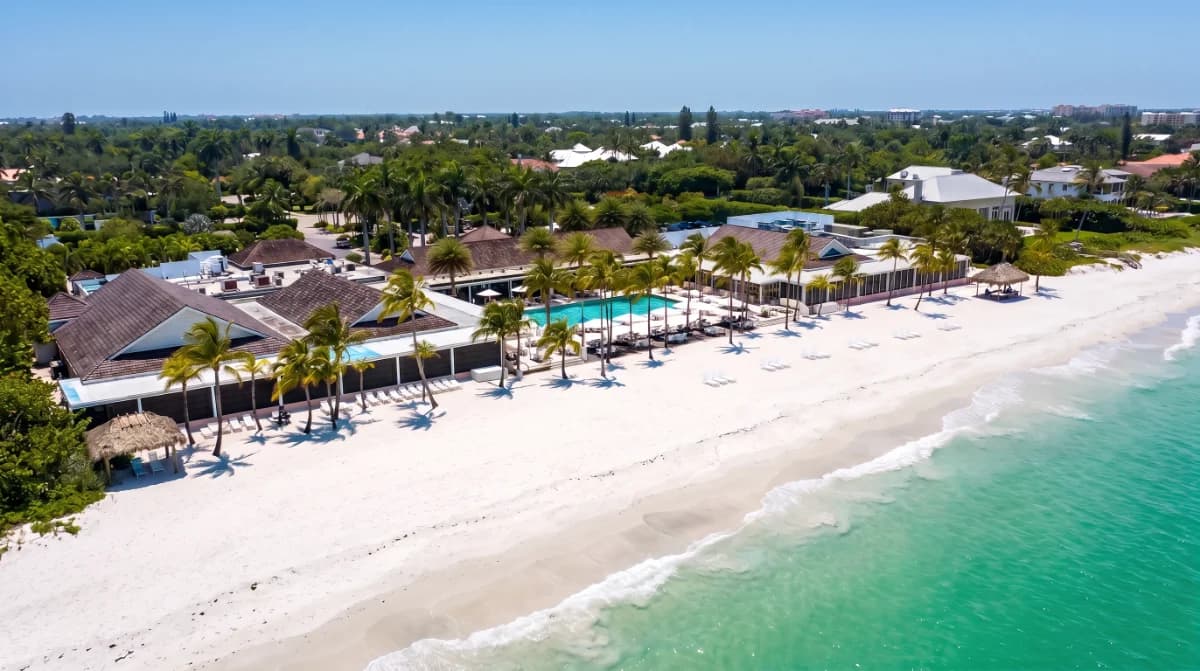
area
Port Royal
Port Royal is widely regarded as one of Naples’ most exclusive waterfront communities, defined by its estate properties, direct Gulf access, and private club lifestyle. The neighborhood features some of the most significant residential properties in Southwest Florida.
Waterfront Estates & Boating
Many homes in Port Royal offer expansive water frontage, private docks, and unobstructed access to the Gulf of Mexico. The community is designed for large-scale waterfront living, with an emphasis on privacy and seamless boating access.
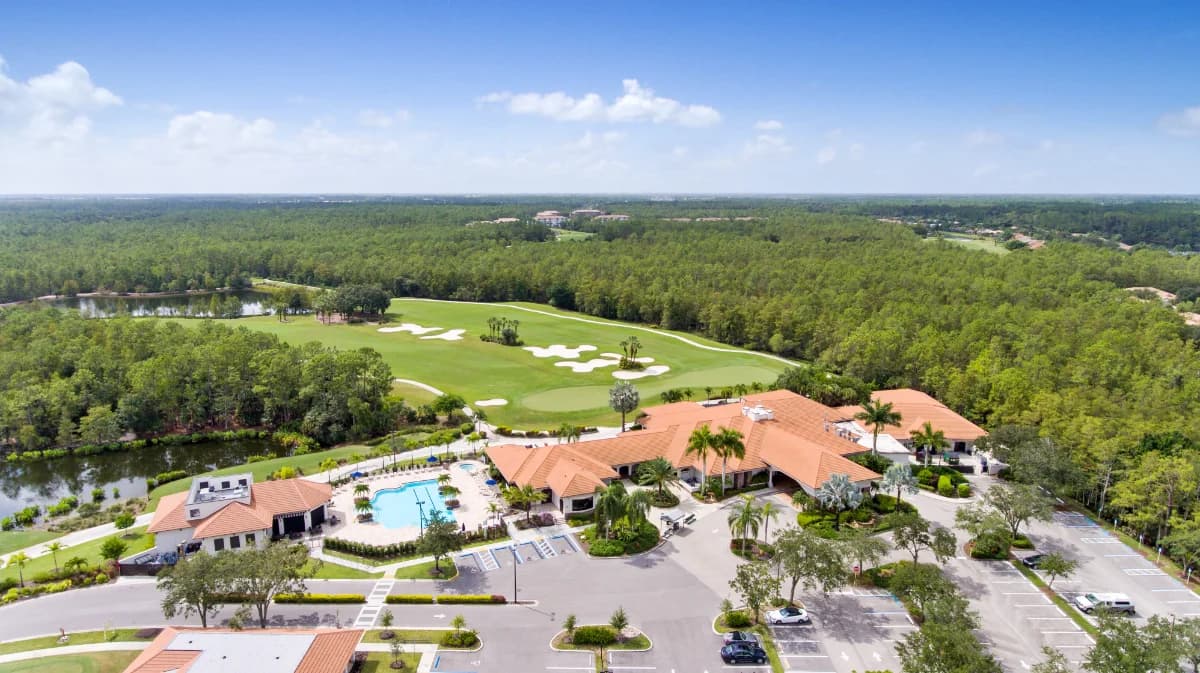
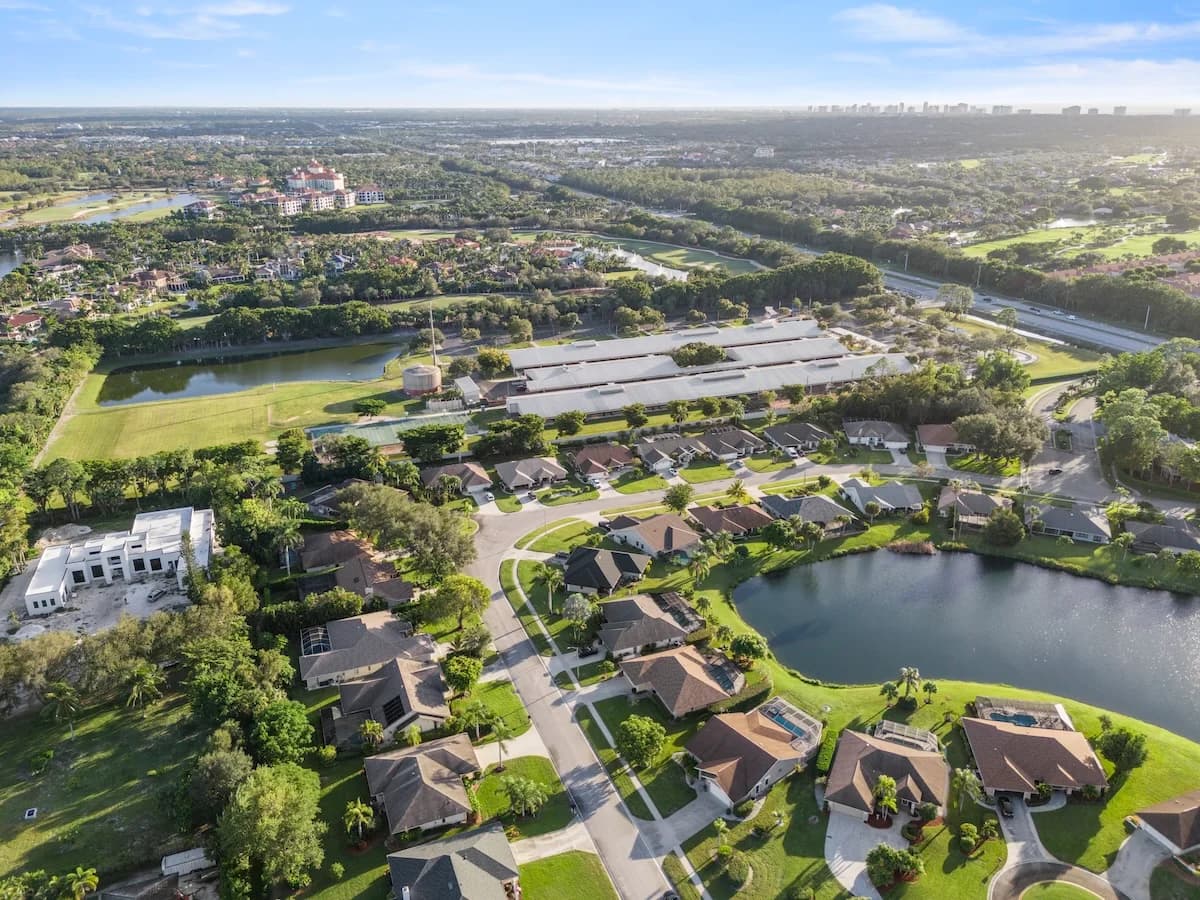
Location & Lifestyle
Located just south of Old Naples, Port Royal provides convenient access to downtown while maintaining a distinctly private atmosphere. Membership to the Port Royal Club further enhances the lifestyle with beachfront dining and amenities reserved for residents.
Properties for Sale
Market Snapshot
Here's the latest snapshot of the Port Royal real estate market in Naples, Florida, as of early May 2026. The median sale price in April 2026 was $28,250,000. Prior to that, the median sales prices were $16,750,000 in March 2026 and $19,950,000 in February 2026. The price per square foot in April was $3,461, down from January 2026's recent high of $3,593. Inventory levels in Port Royal remain substantial. The number of homes for sale in April 2026 was 26, down slightly from 27 in March 2026. The months' supply of inventory was 11.8 in April 2026, up slightly from 10 in the prior three months. Sales activity in Port Royal shows 3 closed sales in April 2026, consistent with 3 sales in both February and March 2026. Pending sales increased to 5 in April 2026, up from 4 in March 2026. This level is significantly higher than the 0-1 pending sales seen in June-November of 2025.
May 2026 · Last updated May 2, 2026
Pricing
Track how home values are trending in Port Royal. Median sale prices and price-per-square-foot data help buyers and sellers gauge current market positioning.
Median Closed Price
$11,250,000 as of May 2026, down 31.7% year-over-year.
View monthly data
| Month | Median Closed Price |
|---|---|
| April 2025 | $22,500,000 |
| May 2025 | $16,475,000 |
| June 2025 | $19,700,000 |
| August 2025 | $21,250,000 |
| September 2025 | $24,950,000 |
| October 2025 | $11,350,000 |
| November 2025 | $35,000,000 |
| January 2026 | $55,000,000 |
| February 2026 | $19,950,000 |
| March 2026 | $16,750,000 |
| April 2026 | $18,725,000 |
| May 2026 | $11,250,000 |
Source: Naples Area Board of REALTORS® (NABOR®) MLS, via InfoSparks. Data through May 2026. Data deemed reliable but not guaranteed.
Median Prices per Sq ft
$1,830 as of May 2026, down 19.4% year-over-year.
View monthly data
| Month | Median Prices per Sq ft |
|---|---|
| April 2025 | $3,058 |
| May 2025 | $2,271 |
| June 2025 | $2,348 |
| August 2025 | $2,558 |
| September 2025 | $3,304 |
| October 2025 | $2,724 |
| November 2025 | $4,178 |
| January 2026 | $3,593 |
| February 2026 | $2,962 |
| March 2026 | $2,352 |
| April 2026 | $2,663 |
| May 2026 | $1,830 |
Source: Naples Area Board of REALTORS® (NABOR®) MLS, via InfoSparks. Data through May 2026. Data deemed reliable but not guaranteed.
Median Closed Price
$11,250,000 as of May 2026, down 31.7% year-over-year.
View monthly data
| Month | Median Closed Price |
|---|---|
| April 2025 | $22,500,000 |
| May 2025 | $16,475,000 |
| June 2025 | $19,700,000 |
| August 2025 | $21,250,000 |
| September 2025 | $24,950,000 |
| October 2025 | $11,350,000 |
| November 2025 | $35,000,000 |
| January 2026 | $55,000,000 |
| February 2026 | $19,950,000 |
| March 2026 | $16,750,000 |
| April 2026 | $18,725,000 |
| May 2026 | $11,250,000 |
Source: Naples Area Board of REALTORS® (NABOR®) MLS, via InfoSparks. Data through May 2026. Data deemed reliable but not guaranteed.
$1,830 as of May 2026, down 19.4% year-over-year.
View monthly data
| Month | Median Prices per Sq ft |
|---|---|
| April 2025 | $3,058 |
| May 2025 | $2,271 |
| June 2025 | $2,348 |
| August 2025 | $2,558 |
| September 2025 | $3,304 |
| October 2025 | $2,724 |
| November 2025 | $4,178 |
| January 2026 | $3,593 |
| February 2026 | $2,962 |
| March 2026 | $2,352 |
| April 2026 | $2,663 |
| May 2026 | $1,830 |
Source: Naples Area Board of REALTORS® (NABOR®) MLS, via InfoSparks. Data through May 2026. Data deemed reliable but not guaranteed.
Inventory
See how many homes are available in Port Royal and how quickly inventory is moving. Months of supply indicates whether conditions favor buyers or sellers.
Homes For Sale
27 as of May 2026, down 20.6% year-over-year.
View monthly data
| Month | Homes For Sale |
|---|---|
| June 2025 | 32 |
| July 2025 | 28 |
| August 2025 | 24 |
| September 2025 | 19 |
| October 2025 | 19 |
| November 2025 | 22 |
| December 2025 | 23 |
| January 2026 | 29 |
| February 2026 | 29 |
| March 2026 | 27 |
| April 2026 | 28 |
| May 2026 | 27 |
Source: Naples Area Board of REALTORS® (NABOR®) MLS, via InfoSparks. Data through May 2026. Data deemed reliable but not guaranteed.
Months Supply
11.7 as of May 2026, down 3.3% year-over-year.
View monthly data
| Month | Months Supply |
|---|---|
| June 2025 | 11.9 |
| July 2025 | 9.7 |
| August 2025 | 8 |
| September 2025 | 6.3 |
| October 2025 | 6.1 |
| November 2025 | 7.6 |
| December 2025 | 7.9 |
| January 2026 | 10 |
| February 2026 | 10 |
| March 2026 | 10 |
| April 2026 | 12.2 |
| May 2026 | 11.7 |
Source: Naples Area Board of REALTORS® (NABOR®) MLS, via InfoSparks. Data through May 2026. Data deemed reliable but not guaranteed.
Homes For Sale
27 as of May 2026, down 20.6% year-over-year.
View monthly data
| Month | Homes For Sale |
|---|---|
| June 2025 | 32 |
| July 2025 | 28 |
| August 2025 | 24 |
| September 2025 | 19 |
| October 2025 | 19 |
| November 2025 | 22 |
| December 2025 | 23 |
| January 2026 | 29 |
| February 2026 | 29 |
| March 2026 | 27 |
| April 2026 | 28 |
| May 2026 | 27 |
Source: Naples Area Board of REALTORS® (NABOR®) MLS, via InfoSparks. Data through May 2026. Data deemed reliable but not guaranteed.
11.7 as of May 2026, down 3.3% year-over-year.
View monthly data
| Month | Months Supply |
|---|---|
| June 2025 | 11.9 |
| July 2025 | 9.7 |
| August 2025 | 8 |
| September 2025 | 6.3 |
| October 2025 | 6.1 |
| November 2025 | 7.6 |
| December 2025 | 7.9 |
| January 2026 | 10 |
| February 2026 | 10 |
| March 2026 | 10 |
| April 2026 | 12.2 |
| May 2026 | 11.7 |
Source: Naples Area Board of REALTORS® (NABOR®) MLS, via InfoSparks. Data through May 2026. Data deemed reliable but not guaranteed.
Activity
Monitor real estate transaction volume in Port Royal. Pending and closed sales reflect the pace of buyer demand and overall market momentum.
Pending Sales
2 as of May 2026, down 33.3% year-over-year.
View monthly data
| Month | Pending Sales |
|---|---|
| June 2025 | 0 |
| July 2025 | 1 |
| August 2025 | 2 |
| September 2025 | 3 |
| October 2025 | 2 |
| November 2025 | 0 |
| December 2025 | 1 |
| January 2026 | 3 |
| February 2026 | 3 |
| March 2026 | 4 |
| April 2026 | 4 |
| May 2026 | 2 |
Source: Naples Area Board of REALTORS® (NABOR®) MLS, via InfoSparks. Data through May 2026. Data deemed reliable but not guaranteed.
Total Sales
2 as of May 2026, up 0.0% year-over-year.
View monthly data
| Month | Total Sales |
|---|---|
| June 2025 | 2 |
| July 2025 | 0 |
| August 2025 | 2 |
| September 2025 | 1 |
| October 2025 | 4 |
| November 2025 | 1 |
| December 2025 | 0 |
| January 2026 | 1 |
| February 2026 | 3 |
| March 2026 | 3 |
| April 2026 | 4 |
| May 2026 | 2 |
Source: Naples Area Board of REALTORS® (NABOR®) MLS, via InfoSparks. Data through May 2026. Data deemed reliable but not guaranteed.
Pending Sales
2 as of May 2026, down 33.3% year-over-year.
View monthly data
| Month | Pending Sales |
|---|---|
| June 2025 | 0 |
| July 2025 | 1 |
| August 2025 | 2 |
| September 2025 | 3 |
| October 2025 | 2 |
| November 2025 | 0 |
| December 2025 | 1 |
| January 2026 | 3 |
| February 2026 | 3 |
| March 2026 | 4 |
| April 2026 | 4 |
| May 2026 | 2 |
Source: Naples Area Board of REALTORS® (NABOR®) MLS, via InfoSparks. Data through May 2026. Data deemed reliable but not guaranteed.
2 as of May 2026, up 0.0% year-over-year.
View monthly data
| Month | Total Sales |
|---|---|
| June 2025 | 2 |
| July 2025 | 0 |
| August 2025 | 2 |
| September 2025 | 1 |
| October 2025 | 4 |
| November 2025 | 1 |
| December 2025 | 0 |
| January 2026 | 1 |
| February 2026 | 3 |
| March 2026 | 3 |
| April 2026 | 4 |
| May 2026 | 2 |
Source: Naples Area Board of REALTORS® (NABOR®) MLS, via InfoSparks. Data through May 2026. Data deemed reliable but not guaranteed.
