Naples Reserve
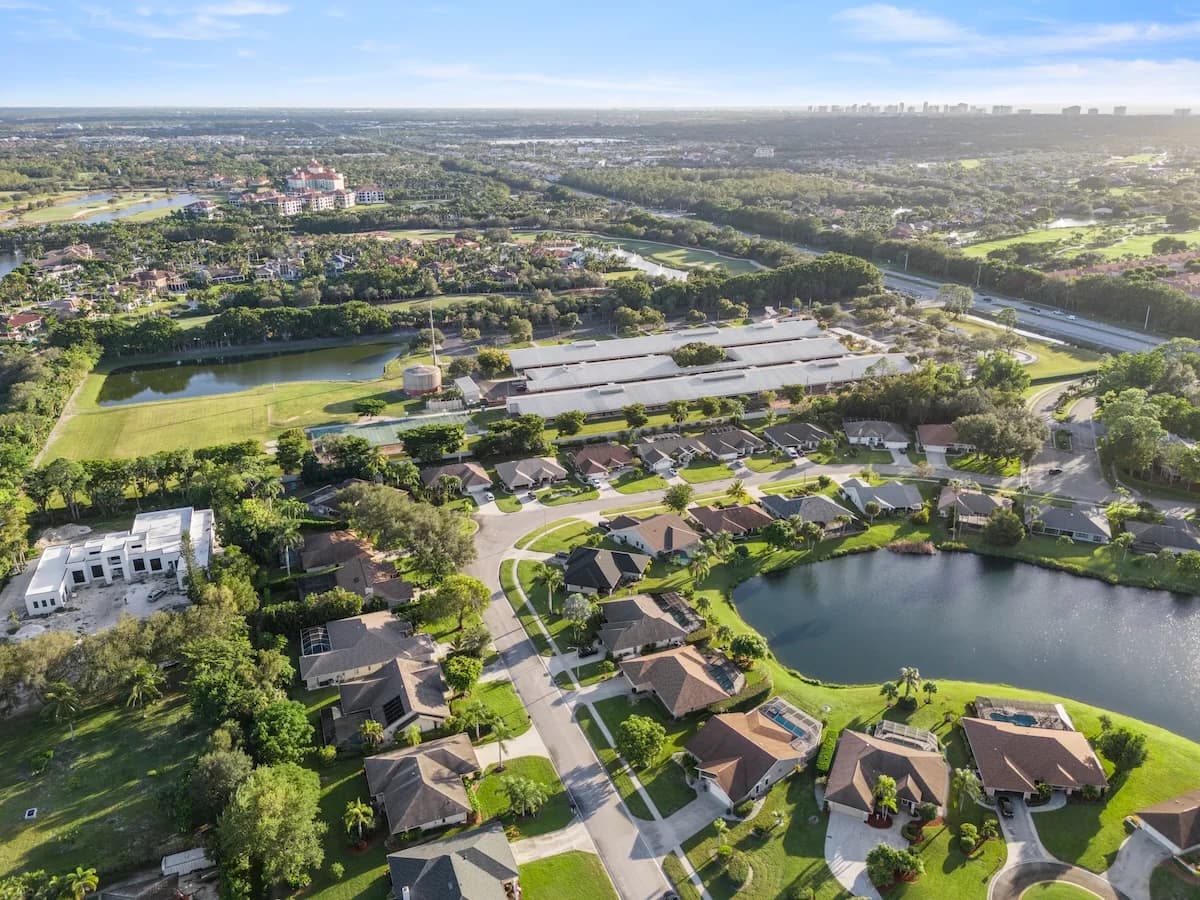
Naples Reserve is a master-planned community in South Naples designed around a ''casually awesome'' lifestyle. The community features 21 freshwater lakes, including the 125-acre Eagle Lake, and 11 lakefront neighborhoods that create a picturesque setting for residents.
Community Amenities
At the heart of Naples Reserve is the Island Club, which serves as the social hub of the community. The amenity complex includes a resort-style pool, Latitudes Café, and Tiki Bar where residents gather and socialize. The state-of-the-art fitness center provides modern equipment for all fitness levels.
Water enthusiasts enjoy complimentary access to paddleboards, water bikes, kayaks, and canoes on Eagle Lake. The Match Point Complex offers five tennis courts and four pickleball courts in a scenic lakeside setting. For pet owners, the community provides two dog parks: Walk & Wag and Paws Awhile.
Additional recreational facilities include the Outrigger Activities Center with bocce ball and beach volleyball courts. The community is also developing The Reserve Club as an additional amenity space.
Lifestyle & Location
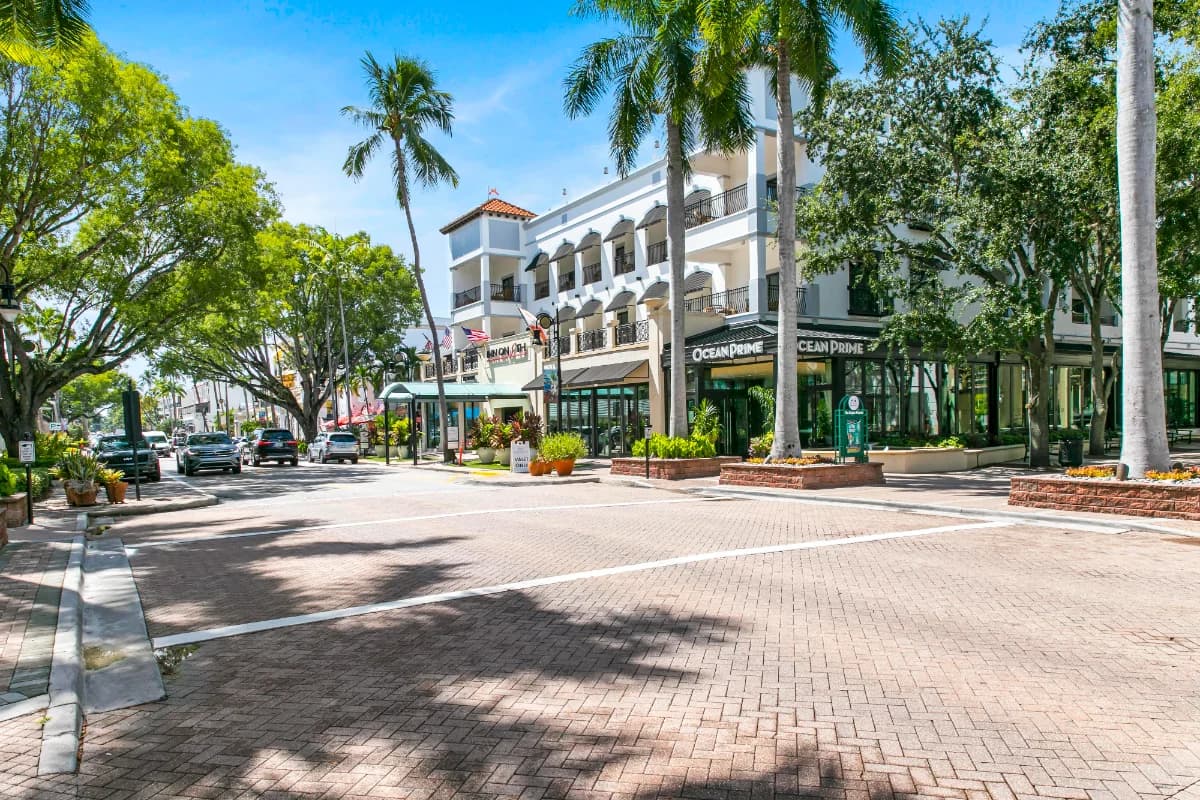
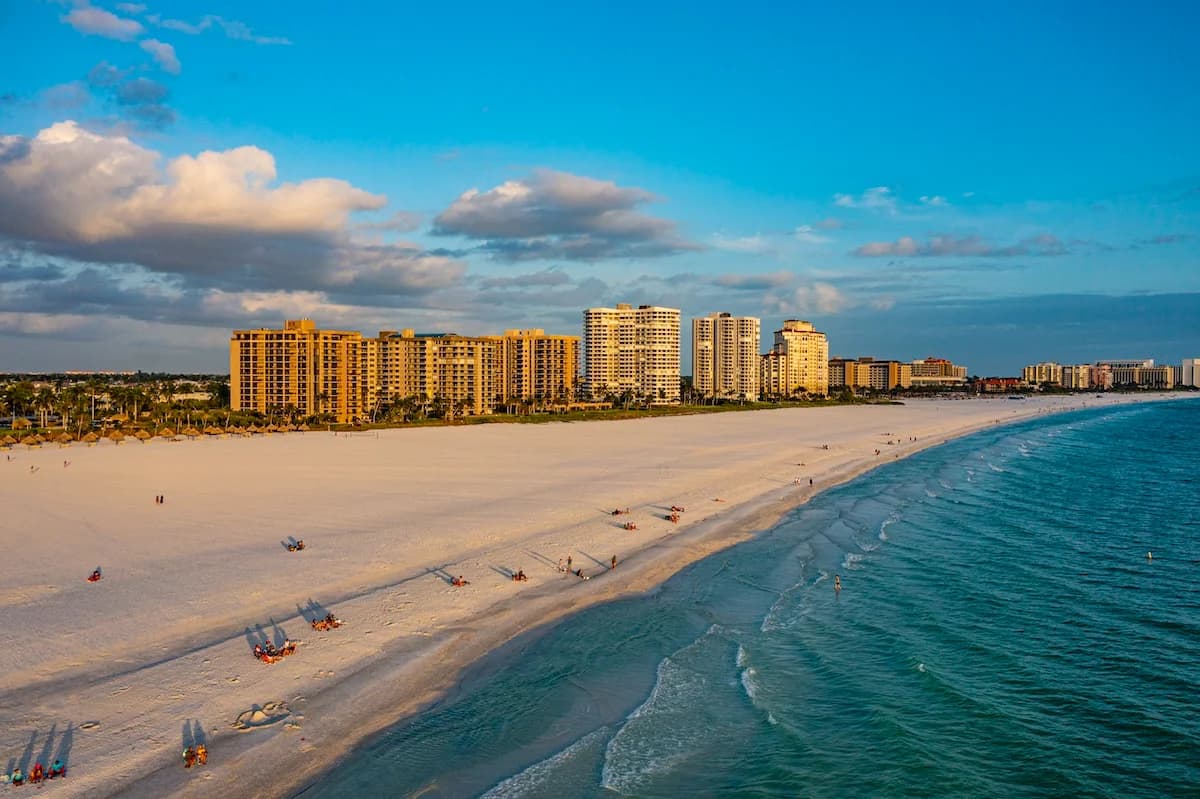
Naples Reserve promotes an active, social lifestyle with organized activities and events throughout the year. The community''s location in South Naples provides convenient access to shopping, dining, beaches, and all that Southwest Florida has to offer.
Quick Facts
- Residences
- 11 lakefront neighborhoods
- Location
- South Naples
- Lifestyle
- Casually awesome with resort-style amenities
Properties for Sale
Market Snapshot
The median closed price in Naples Reserve, South Naples was $992,500 in September 2026, up 70.4% from $582,500 a year earlier, according to NABOR MLS data through September 2026. For single-family homes, the median price in September 2026 was $1,579,750, while for condos, it was $487,000. The median price per square foot for all property types was $420 in September 2026, up from $300 in September 2025. Inventory in Naples Reserve saw a decrease in September 2026, with 17 homes for sale, compared to 27 in September 2025. Single-family homes for sale decreased from 24 in September 2025 to 16 in September 2026, while condos for sale decreased from 3 to 1 during the same period. Months supply of inventory for all property types was 3.2 months in September 2026, a decrease from 4.5 months in September 2025. Sales activity in September 2026 showed 6 total sales, an increase from 4 total sales in September 2025. There were 4 single-family sales and 2 condo sales in September 2026. Pending sales for all property types totaled 5 in September 2026, up from 2 pending sales in September 2025. This included 4 single-family pending sales and 1 condo pending sale in September 2026.
October 2026 · Last updated Oct 2, 2026
Pricing
Track how home values are trending in Naples Reserve. Median sale prices and price-per-square-foot data help buyers and sellers gauge current market positioning.
Median Closed Price
$992,500 as of September 2026, up 70.4% year-over-year.
View monthly data
| Month | Median Closed Price |
|---|---|
| October 2025 | $585,000 |
| November 2025 | $1,125,000 |
| December 2025 | $886,000 |
| January 2026 | $962,500 |
| February 2026 | $1,030,000 |
| March 2026 | $638,500 |
| April 2026 | $1,035,000 |
| May 2026 | $1,350,000 |
| June 2026 | $957,500 |
| July 2026 | $1,659,250 |
| August 2026 | $1,103,750 |
| September 2026 | $992,500 |
Source: Naples Area Board of REALTORS® (NABOR®) MLS, via InfoSparks. Data through September 2026. Data deemed reliable but not guaranteed.
Median Prices per Sq ft
$420 as of September 2026, up 40.0% year-over-year.
View monthly data
| Month | Median Prices per Sq ft |
|---|---|
| October 2025 | $347 |
| November 2025 | $471 |
| December 2025 | $367 |
| January 2026 | $447 |
| February 2026 | $466 |
| March 2026 | $374 |
| April 2026 | $438 |
| May 2026 | $552 |
| June 2026 | $392 |
| July 2026 | $608 |
| August 2026 | $484 |
| September 2026 | $420 |
Source: Naples Area Board of REALTORS® (NABOR®) MLS, via InfoSparks. Data through September 2026. Data deemed reliable but not guaranteed.
Median Closed Price
$992,500 as of September 2026, up 70.4% year-over-year.
View monthly data
| Month | Median Closed Price |
|---|---|
| October 2025 | $585,000 |
| November 2025 | $1,125,000 |
| December 2025 | $886,000 |
| January 2026 | $962,500 |
| February 2026 | $1,030,000 |
| March 2026 | $638,500 |
| April 2026 | $1,035,000 |
| May 2026 | $1,350,000 |
| June 2026 | $957,500 |
| July 2026 | $1,659,250 |
| August 2026 | $1,103,750 |
| September 2026 | $992,500 |
Source: Naples Area Board of REALTORS® (NABOR®) MLS, via InfoSparks. Data through September 2026. Data deemed reliable but not guaranteed.
$420 as of September 2026, up 40.0% year-over-year.
View monthly data
| Month | Median Prices per Sq ft |
|---|---|
| October 2025 | $347 |
| November 2025 | $471 |
| December 2025 | $367 |
| January 2026 | $447 |
| February 2026 | $466 |
| March 2026 | $374 |
| April 2026 | $438 |
| May 2026 | $552 |
| June 2026 | $392 |
| July 2026 | $608 |
| August 2026 | $484 |
| September 2026 | $420 |
Source: Naples Area Board of REALTORS® (NABOR®) MLS, via InfoSparks. Data through September 2026. Data deemed reliable but not guaranteed.
Inventory
See how many homes are available in Naples Reserve and how quickly inventory is moving. Months of supply indicates whether conditions favor buyers or sellers.
Homes For Sale
17 as of September 2026, down 37.0% year-over-year.
View monthly data
| Month | Homes For Sale |
|---|---|
| October 2025 | 35 |
| November 2025 | 35 |
| December 2025 | 39 |
| January 2026 | 39 |
| February 2026 | 39 |
| March 2026 | 33 |
| April 2026 | 30 |
| May 2026 | 31 |
| June 2026 | 28 |
| July 2026 | 23 |
| August 2026 | 18 |
| September 2026 | 17 |
Source: Naples Area Board of REALTORS® (NABOR®) MLS, via InfoSparks. Data through September 2026. Data deemed reliable but not guaranteed.
Months Supply
3.2 as of September 2026, down 28.9% year-over-year.
View monthly data
| Month | Months Supply |
|---|---|
| October 2025 | 6.1 |
| November 2025 | 6.2 |
| December 2025 | 6.9 |
| January 2026 | 7.3 |
| February 2026 | 7.5 |
| March 2026 | 5.7 |
| April 2026 | 5.5 |
| May 2026 | 5.4 |
| June 2026 | 4.9 |
| July 2026 | 4.1 |
| August 2026 | 3.5 |
| September 2026 | 3.2 |
Source: Naples Area Board of REALTORS® (NABOR®) MLS, via InfoSparks. Data through September 2026. Data deemed reliable but not guaranteed.
Homes For Sale
17 as of September 2026, down 37.0% year-over-year.
View monthly data
| Month | Homes For Sale |
|---|---|
| October 2025 | 35 |
| November 2025 | 35 |
| December 2025 | 39 |
| January 2026 | 39 |
| February 2026 | 39 |
| March 2026 | 33 |
| April 2026 | 30 |
| May 2026 | 31 |
| June 2026 | 28 |
| July 2026 | 23 |
| August 2026 | 18 |
| September 2026 | 17 |
Source: Naples Area Board of REALTORS® (NABOR®) MLS, via InfoSparks. Data through September 2026. Data deemed reliable but not guaranteed.
3.2 as of September 2026, down 28.9% year-over-year.
View monthly data
| Month | Months Supply |
|---|---|
| October 2025 | 6.1 |
| November 2025 | 6.2 |
| December 2025 | 6.9 |
| January 2026 | 7.3 |
| February 2026 | 7.5 |
| March 2026 | 5.7 |
| April 2026 | 5.5 |
| May 2026 | 5.4 |
| June 2026 | 4.9 |
| July 2026 | 4.1 |
| August 2026 | 3.5 |
| September 2026 | 3.2 |
Source: Naples Area Board of REALTORS® (NABOR®) MLS, via InfoSparks. Data through September 2026. Data deemed reliable but not guaranteed.
Activity
Monitor real estate transaction volume in Naples Reserve. Pending and closed sales reflect the pace of buyer demand and overall market momentum.
Pending Sales
5 as of September 2026, up 150.0% year-over-year.
View monthly data
| Month | Pending Sales |
|---|---|
| October 2025 | 2 |
| November 2025 | 4 |
| December 2025 | 2 |
| January 2026 | 9 |
| February 2026 | 7 |
| March 2026 | 10 |
| April 2026 | 10 |
| May 2026 | 4 |
| June 2026 | 6 |
| July 2026 | 3 |
| August 2026 | 7 |
| September 2026 | 5 |
Source: Naples Area Board of REALTORS® (NABOR®) MLS, via InfoSparks. Data through September 2026. Data deemed reliable but not guaranteed.
Total Sales
6 as of September 2026, up 50.0% year-over-year.
View monthly data
| Month | Total Sales |
|---|---|
| October 2025 | 1 |
| November 2025 | 2 |
| December 2025 | 5 |
| January 2026 | 2 |
| February 2026 | 4 |
| March 2026 | 10 |
| April 2026 | 8 |
| May 2026 | 9 |
| June 2026 | 5 |
| July 2026 | 8 |
| August 2026 | 4 |
| September 2026 | 6 |
Source: Naples Area Board of REALTORS® (NABOR®) MLS, via InfoSparks. Data through September 2026. Data deemed reliable but not guaranteed.
Pending Sales
5 as of September 2026, up 150.0% year-over-year.
View monthly data
| Month | Pending Sales |
|---|---|
| October 2025 | 2 |
| November 2025 | 4 |
| December 2025 | 2 |
| January 2026 | 9 |
| February 2026 | 7 |
| March 2026 | 10 |
| April 2026 | 10 |
| May 2026 | 4 |
| June 2026 | 6 |
| July 2026 | 3 |
| August 2026 | 7 |
| September 2026 | 5 |
Source: Naples Area Board of REALTORS® (NABOR®) MLS, via InfoSparks. Data through September 2026. Data deemed reliable but not guaranteed.
6 as of September 2026, up 50.0% year-over-year.
View monthly data
| Month | Total Sales |
|---|---|
| October 2025 | 1 |
| November 2025 | 2 |
| December 2025 | 5 |
| January 2026 | 2 |
| February 2026 | 4 |
| March 2026 | 10 |
| April 2026 | 8 |
| May 2026 | 9 |
| June 2026 | 5 |
| July 2026 | 8 |
| August 2026 | 4 |
| September 2026 | 6 |
Source: Naples Area Board of REALTORS® (NABOR®) MLS, via InfoSparks. Data through September 2026. Data deemed reliable but not guaranteed.