Marbella Isles
Gated
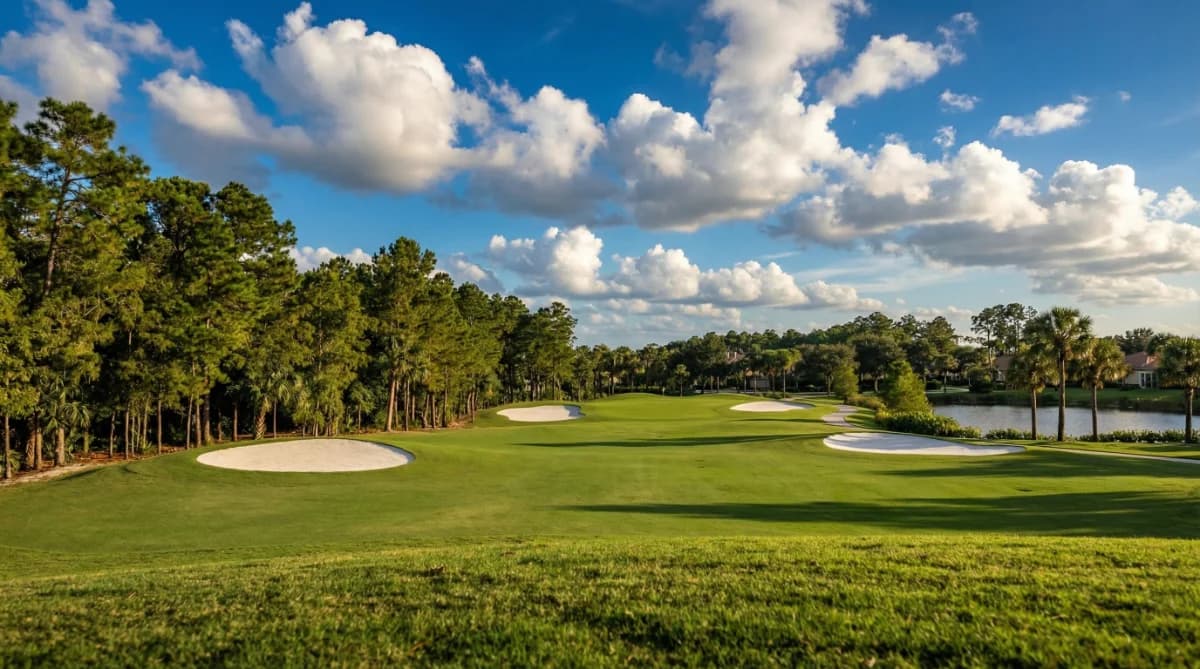
Marbella Isles is a gated community with a casual, active lifestyle designed for residents of all ages and families. The community features 466 residences surrounding 8 lakes with beautiful, tropical landscaping. Homes include both villas and single-family residences, all with garages.
Amenities & Lifestyle
The centerpiece of community life is the 9,500 square foot clubhouse featuring a resort-style pool, spa, and children''s water play area. Inside the clubhouse, residents enjoy a full-sized basketball court that doubles as a multi-purpose room, card and game rooms, a fitness center with cardio equipment, free weights and weight machines, plus meeting and social rooms.
Outdoor amenities include tennis courts, pickleball courts, bocce, and a children''s play area. The community is proud to be Blue Zone Project recognized, emphasizing wellness and active living.
Location
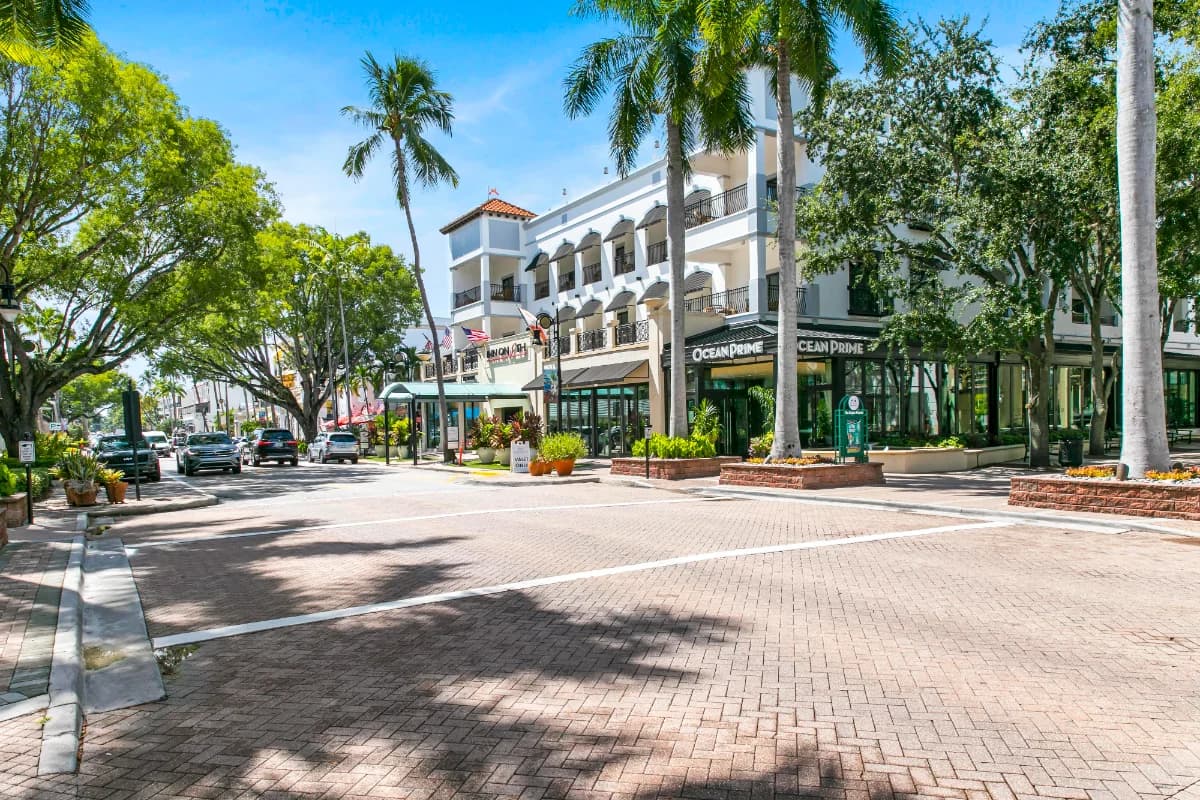
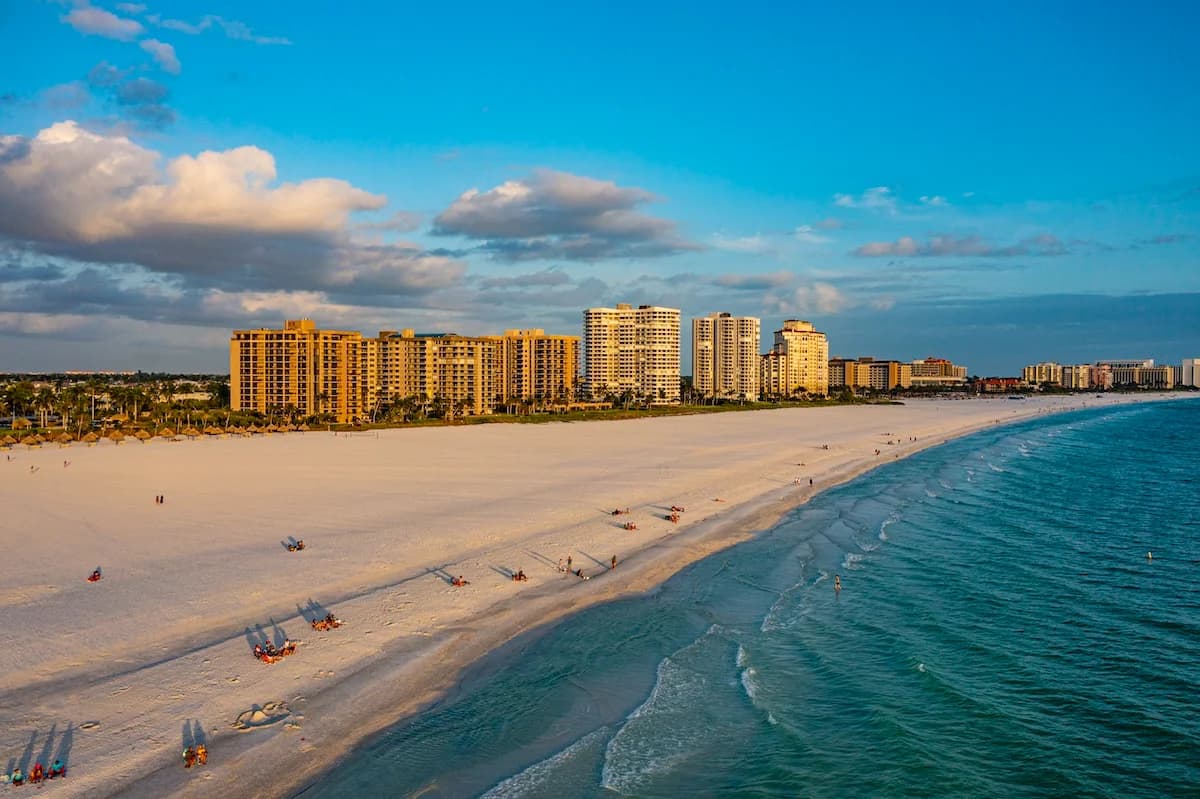
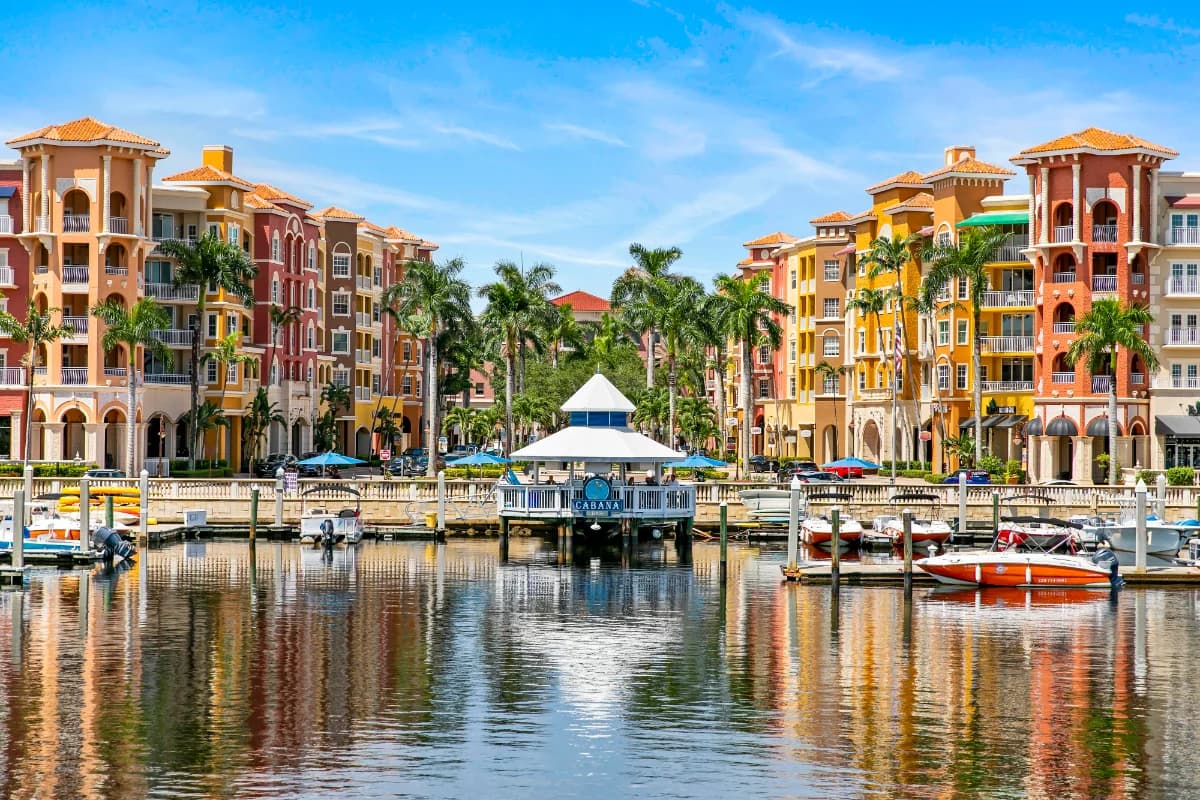
Marbella Isles is located in the heart of Naples between Livingston and Airport Pulling Roads, with guest access at Livingston. The community enjoys close proximity to private and public schools, churches, the Collier County Public Library, Naples Philharmonic, beautiful beaches, fine dining, and shopping. Both Southwest Florida International Airport and Naples Municipal Airport are easily accessible, as are the Marco Island and Fort Myers ferry services to Key West.
Quick Facts
- Gated
- Yes, with guest access
- Residences
- 466 homes
- Location
- Central Naples between Livingston & Airport Pulling
- Lifestyle
- All-ages, active community
Properties for Sale
Market Snapshot
The median closed price in Marbella Isles, Old Naples, was $770,000 in September 2026, based on a single condo sale. This represents a decrease from the $1,245,000 median recorded in September 2023, according to NABOR MLS data through September 2026. For all property types combined, the median price per square foot was $375 in September 2026, based on that same condo sale. In contrast, the median price per square foot for single-family homes was $461 in August 2026 and for condos was $357 in August 2026, both based on small sample sizes. Total sales activity in Marbella Isles saw one condo close in September 2026. This is lower than the five total sales recorded in September 2023, which included four single-family homes and one condo. Looking at pending sales, there were three pending sales (two single-family homes and one condo) in September 2026. This is an increase from the two pending sales (two single-family homes) in September 2023. The inventory of homes for sale in Marbella Isles decreased slightly, with 12 homes on the market in September 2026, consisting of 6 single-family homes and 6 condos. This is higher than the 2 total homes for sale in September 2023. Months supply of inventory for all property types was 5.5 months in September 2026, indicating a balanced market. This is a significant increase from the 0.7 months supply observed in September 2023, reflecting a change in market conditions over the three-year period.
October 2026 · Last updated Oct 2, 2026
Pricing
Track how home values are trending in Marbella Isles. Median sale prices and price-per-square-foot data help buyers and sellers gauge current market positioning.
Median Closed Price
$770,000 as of September 2026.
View monthly data
| Month | Median Closed Price |
|---|---|
| October 2025 | $1,400,000 |
| November 2025 | $933,000 |
| December 2025 | $942,500 |
| January 2026 | $745,000 |
| February 2026 | $705,000 |
| March 2026 | $810,000 |
| April 2026 | $925,000 |
| May 2026 | $945,000 |
| June 2026 | $1,417,500 |
| July 2026 | $875,000 |
| August 2026 | $1,121,500 |
| September 2026 | $770,000 |
Source: Naples Area Board of REALTORS® (NABOR®) MLS, via InfoSparks. Data through September 2026. Data deemed reliable but not guaranteed.
Median Prices per Sq ft
$375 as of September 2026.
View monthly data
| Month | Median Prices per Sq ft |
|---|---|
| October 2025 | $409 |
| November 2025 | $413 |
| December 2025 | $342 |
| January 2026 | $369 |
| February 2026 | $379 |
| March 2026 | $351 |
| April 2026 | $418 |
| May 2026 | $385 |
| June 2026 | $409 |
| July 2026 | $392 |
| August 2026 | $409 |
| September 2026 | $375 |
Source: Naples Area Board of REALTORS® (NABOR®) MLS, via InfoSparks. Data through September 2026. Data deemed reliable but not guaranteed.
Median Closed Price
$770,000 as of September 2026.
View monthly data
| Month | Median Closed Price |
|---|---|
| October 2025 | $1,400,000 |
| November 2025 | $933,000 |
| December 2025 | $942,500 |
| January 2026 | $745,000 |
| February 2026 | $705,000 |
| March 2026 | $810,000 |
| April 2026 | $925,000 |
| May 2026 | $945,000 |
| June 2026 | $1,417,500 |
| July 2026 | $875,000 |
| August 2026 | $1,121,500 |
| September 2026 | $770,000 |
Source: Naples Area Board of REALTORS® (NABOR®) MLS, via InfoSparks. Data through September 2026. Data deemed reliable but not guaranteed.
$375 as of September 2026.
View monthly data
| Month | Median Prices per Sq ft |
|---|---|
| October 2025 | $409 |
| November 2025 | $413 |
| December 2025 | $342 |
| January 2026 | $369 |
| February 2026 | $379 |
| March 2026 | $351 |
| April 2026 | $418 |
| May 2026 | $385 |
| June 2026 | $409 |
| July 2026 | $392 |
| August 2026 | $409 |
| September 2026 | $375 |
Source: Naples Area Board of REALTORS® (NABOR®) MLS, via InfoSparks. Data through September 2026. Data deemed reliable but not guaranteed.
Inventory
See how many homes are available in Marbella Isles and how quickly inventory is moving. Months of supply indicates whether conditions favor buyers or sellers.
Homes For Sale
13 as of September 2026, down 7.1% year-over-year.
View monthly data
| Month | Homes For Sale |
|---|---|
| October 2025 | 15 |
| November 2025 | 15 |
| December 2025 | 14 |
| January 2026 | 19 |
| February 2026 | 18 |
| March 2026 | 18 |
| April 2026 | 12 |
| May 2026 | 10 |
| June 2026 | 13 |
| July 2026 | 15 |
| August 2026 | 15 |
| September 2026 | 13 |
Source: Naples Area Board of REALTORS® (NABOR®) MLS, via InfoSparks. Data through September 2026. Data deemed reliable but not guaranteed.
Months Supply
6 as of September 2026, down 23.1% year-over-year.
View monthly data
| Month | Months Supply |
|---|---|
| October 2025 | 8.8 |
| November 2025 | 8.3 |
| December 2025 | 7.8 |
| January 2026 | 10.6 |
| February 2026 | 10 |
| March 2026 | 9.5 |
| April 2026 | 6.3 |
| May 2026 | 5.3 |
| June 2026 | 5.7 |
| July 2026 | 6.9 |
| August 2026 | 6.6 |
| September 2026 | 6 |
Source: Naples Area Board of REALTORS® (NABOR®) MLS, via InfoSparks. Data through September 2026. Data deemed reliable but not guaranteed.
Homes For Sale
13 as of September 2026, down 7.1% year-over-year.
View monthly data
| Month | Homes For Sale |
|---|---|
| October 2025 | 15 |
| November 2025 | 15 |
| December 2025 | 14 |
| January 2026 | 19 |
| February 2026 | 18 |
| March 2026 | 18 |
| April 2026 | 12 |
| May 2026 | 10 |
| June 2026 | 13 |
| July 2026 | 15 |
| August 2026 | 15 |
| September 2026 | 13 |
Source: Naples Area Board of REALTORS® (NABOR®) MLS, via InfoSparks. Data through September 2026. Data deemed reliable but not guaranteed.
6 as of September 2026, down 23.1% year-over-year.
View monthly data
| Month | Months Supply |
|---|---|
| October 2025 | 8.8 |
| November 2025 | 8.3 |
| December 2025 | 7.8 |
| January 2026 | 10.6 |
| February 2026 | 10 |
| March 2026 | 9.5 |
| April 2026 | 6.3 |
| May 2026 | 5.3 |
| June 2026 | 5.7 |
| July 2026 | 6.9 |
| August 2026 | 6.6 |
| September 2026 | 6 |
Source: Naples Area Board of REALTORS® (NABOR®) MLS, via InfoSparks. Data through September 2026. Data deemed reliable but not guaranteed.
Activity
Monitor real estate transaction volume in Marbella Isles. Pending and closed sales reflect the pace of buyer demand and overall market momentum.
Pending Sales
2 as of September 2026, up 100.0% year-over-year.
View monthly data
| Month | Pending Sales |
|---|---|
| October 2025 | 2 |
| November 2025 | 3 |
| December 2025 | 1 |
| January 2026 | 3 |
| February 2026 | 3 |
| March 2026 | 2 |
| April 2026 | 4 |
| May 2026 | 2 |
| June 2026 | 0 |
| July 2026 | 3 |
| August 2026 | 2 |
| September 2026 | 2 |
Source: Naples Area Board of REALTORS® (NABOR®) MLS, via InfoSparks. Data through September 2026. Data deemed reliable but not guaranteed.
Total Sales
1 as of September 2026.
View monthly data
| Month | Total Sales |
|---|---|
| October 2025 | 1 |
| November 2025 | 3 |
| December 2025 | 2 |
| January 2026 | 3 |
| February 2026 | 1 |
| March 2026 | 2 |
| April 2026 | 3 |
| May 2026 | 1 |
| June 2026 | 6 |
| July 2026 | 1 |
| August 2026 | 2 |
| September 2026 | 1 |
Source: Naples Area Board of REALTORS® (NABOR®) MLS, via InfoSparks. Data through September 2026. Data deemed reliable but not guaranteed.
Pending Sales
2 as of September 2026, up 100.0% year-over-year.
View monthly data
| Month | Pending Sales |
|---|---|
| October 2025 | 2 |
| November 2025 | 3 |
| December 2025 | 1 |
| January 2026 | 3 |
| February 2026 | 3 |
| March 2026 | 2 |
| April 2026 | 4 |
| May 2026 | 2 |
| June 2026 | 0 |
| July 2026 | 3 |
| August 2026 | 2 |
| September 2026 | 2 |
Source: Naples Area Board of REALTORS® (NABOR®) MLS, via InfoSparks. Data through September 2026. Data deemed reliable but not guaranteed.
1 as of September 2026.
View monthly data
| Month | Total Sales |
|---|---|
| October 2025 | 1 |
| November 2025 | 3 |
| December 2025 | 2 |
| January 2026 | 3 |
| February 2026 | 1 |
| March 2026 | 2 |
| April 2026 | 3 |
| May 2026 | 1 |
| June 2026 | 6 |
| July 2026 | 1 |
| August 2026 | 2 |
| September 2026 | 1 |
Source: Naples Area Board of REALTORS® (NABOR®) MLS, via InfoSparks. Data through September 2026. Data deemed reliable but not guaranteed.