Lbuilding
Naples • Park Shore
Le Jardin
Luxury beachfront condominium in Park Shore with spacious residences and Gulf views.
Gated
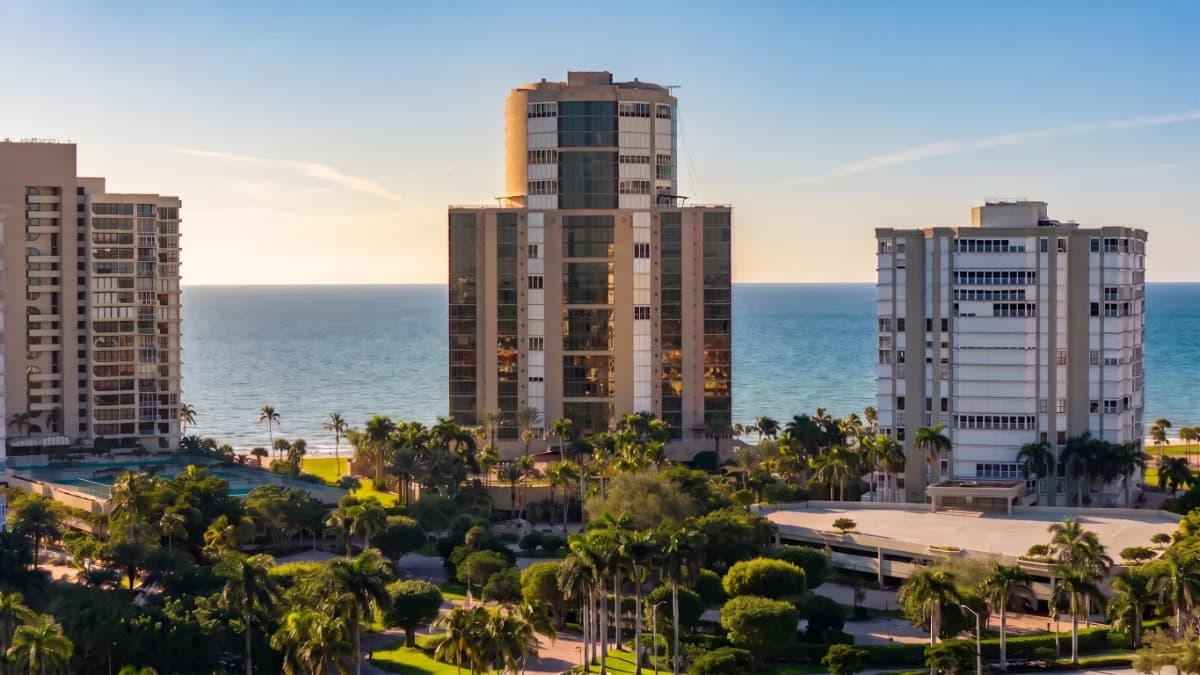
Le Rivage condominium was built in 1997 by the Lutgert Companies to be the ultimate luxury beachfront condominium in Southwest Florida. This exclusive Park Shore community comprises just 37 residential units in a 25-story building, offering an intimate beachfront living experience with world-class amenities.
The building features a unique floor plan design with the first 15 floors containing two residences each, while the top seven floors contain only one residence per floor. The typical floor plan offers over 6,000 square feet of living area, while the seven penthouse units provide over 7,500 square feet. Each residence includes at least three garage spaces, with penthouses featuring four spaces.
Le Rivage offers a guarded entrance gate, 24-hour security, and an on-site manager for residents'' peace of mind. This level of service ensures privacy and security befitting the exclusive nature of the community.
Residents enjoy access to luxury amenities including a beachfront pool and spa, grand social room, card room, Har-Tru tennis court, and a modern, well-equipped fitness room. Additional facilities include a massage room, two guest suites, bike storage, and BBQ/picnic areas. The community offers private beach access and boat slips are available for sale or lease.
Le Rivage welcomes pets with approval, allowing up to 2 dogs or cats per residence. While there is no specific size limit, pets must be carryable.
Track how home values are trending in Le Rivage. Median sale prices and price-per-square-foot data help buyers and sellers gauge current market positioning.
Median Closed Price
$10,212,500 as of March 2026.
| Month | Median Closed Price |
|---|---|
| July 2023 | $10,000,000 |
| August 2024 | $10,000,000 |
| May 2025 | $10,100,000 |
| March 2026 | $10,212,500 |
Source: Naples Area Board of REALTORS® (NABOR®) MLS, via InfoSparks. Data through March 2026. Data deemed reliable but not guaranteed.
Median Prices per Sq ft
$1,685 as of March 2026.
| Month | Median Prices per Sq ft |
|---|---|
| July 2023 | $1,650 |
| August 2024 | $1,650 |
| May 2025 | $1,647 |
| March 2026 | $1,685 |
Source: Naples Area Board of REALTORS® (NABOR®) MLS, via InfoSparks. Data through March 2026. Data deemed reliable but not guaranteed.
Median Closed Price
$10,212,500 as of March 2026.
| Month | Median Closed Price |
|---|---|
| July 2023 | $10,000,000 |
| August 2024 | $10,000,000 |
| May 2025 | $10,100,000 |
| March 2026 | $10,212,500 |
Source: Naples Area Board of REALTORS® (NABOR®) MLS, via InfoSparks. Data through March 2026. Data deemed reliable but not guaranteed.
$1,685 as of March 2026.
| Month | Median Prices per Sq ft |
|---|---|
| July 2023 | $1,650 |
| August 2024 | $1,650 |
| May 2025 | $1,647 |
| March 2026 | $1,685 |
Source: Naples Area Board of REALTORS® (NABOR®) MLS, via InfoSparks. Data through March 2026. Data deemed reliable but not guaranteed.
See how many homes are available in Le Rivage and how quickly inventory is moving. Months of supply indicates whether conditions favor buyers or sellers.
Homes For Sale
0 as of June 2026.
| Month | Homes For Sale |
|---|---|
| July 2025 | 0 |
| August 2025 | 0 |
| September 2025 | 0 |
| October 2025 | 1 |
| November 2025 | 1 |
| December 2025 | 1 |
| January 2026 | 2 |
| February 2026 | 0 |
| March 2026 | 0 |
| April 2026 | 0 |
| May 2026 | 0 |
| June 2026 | 0 |
Source: Naples Area Board of REALTORS® (NABOR®) MLS, via InfoSparks. Data through June 2026. Data deemed reliable but not guaranteed.
Months Supply
2 as of January 2026.
| Month | Months Supply |
|---|---|
| January 2024 | 1 |
| February 2024 | 1 |
| March 2024 | 1 |
| April 2024 | 1 |
| May 2024 | 1 |
| October 2025 | 1 |
| November 2025 | 1 |
| December 2025 | 1 |
| January 2026 | 2 |
Source: Naples Area Board of REALTORS® (NABOR®) MLS, via InfoSparks. Data through January 2026. Data deemed reliable but not guaranteed.
Homes For Sale
0 as of June 2026.
| Month | Homes For Sale |
|---|---|
| July 2025 | 0 |
| August 2025 | 0 |
| September 2025 | 0 |
| October 2025 | 1 |
| November 2025 | 1 |
| December 2025 | 1 |
| January 2026 | 2 |
| February 2026 | 0 |
| March 2026 | 0 |
| April 2026 | 0 |
| May 2026 | 0 |
| June 2026 | 0 |
Source: Naples Area Board of REALTORS® (NABOR®) MLS, via InfoSparks. Data through June 2026. Data deemed reliable but not guaranteed.
2 as of January 2026.
| Month | Months Supply |
|---|---|
| January 2024 | 1 |
| February 2024 | 1 |
| March 2024 | 1 |
| April 2024 | 1 |
| May 2024 | 1 |
| October 2025 | 1 |
| November 2025 | 1 |
| December 2025 | 1 |
| January 2026 | 2 |
Source: Naples Area Board of REALTORS® (NABOR®) MLS, via InfoSparks. Data through January 2026. Data deemed reliable but not guaranteed.
Monitor real estate transaction volume in Le Rivage. Pending and closed sales reflect the pace of buyer demand and overall market momentum.
Pending Sales
0 as of June 2026.
| Month | Pending Sales |
|---|---|
| July 2025 | 0 |
| August 2025 | 0 |
| September 2025 | 0 |
| October 2025 | 0 |
| November 2025 | 0 |
| December 2025 | 0 |
| January 2026 | 0 |
| February 2026 | 2 |
| March 2026 | 0 |
| April 2026 | 0 |
| May 2026 | 0 |
| June 2026 | 0 |
Source: Naples Area Board of REALTORS® (NABOR®) MLS, via InfoSparks. Data through June 2026. Data deemed reliable but not guaranteed.
Total Sales
0 as of June 2026.
| Month | Total Sales |
|---|---|
| July 2025 | 0 |
| August 2025 | 0 |
| September 2025 | 0 |
| October 2025 | 0 |
| November 2025 | 0 |
| December 2025 | 0 |
| January 2026 | 0 |
| February 2026 | 0 |
| March 2026 | 2 |
| April 2026 | 0 |
| May 2026 | 0 |
| June 2026 | 0 |
Source: Naples Area Board of REALTORS® (NABOR®) MLS, via InfoSparks. Data through June 2026. Data deemed reliable but not guaranteed.
Pending Sales
0 as of June 2026.
| Month | Pending Sales |
|---|---|
| July 2025 | 0 |
| August 2025 | 0 |
| September 2025 | 0 |
| October 2025 | 0 |
| November 2025 | 0 |
| December 2025 | 0 |
| January 2026 | 0 |
| February 2026 | 2 |
| March 2026 | 0 |
| April 2026 | 0 |
| May 2026 | 0 |
| June 2026 | 0 |
Source: Naples Area Board of REALTORS® (NABOR®) MLS, via InfoSparks. Data through June 2026. Data deemed reliable but not guaranteed.
0 as of June 2026.
| Month | Total Sales |
|---|---|
| July 2025 | 0 |
| August 2025 | 0 |
| September 2025 | 0 |
| October 2025 | 0 |
| November 2025 | 0 |
| December 2025 | 0 |
| January 2026 | 0 |
| February 2026 | 0 |
| March 2026 | 2 |
| April 2026 | 0 |
| May 2026 | 0 |
| June 2026 | 0 |
Source: Naples Area Board of REALTORS® (NABOR®) MLS, via InfoSparks. Data through June 2026. Data deemed reliable but not guaranteed.
Luxury beachfront condominium in Park Shore with spacious residences and Gulf views.
Exclusive 28-residence beachfront high-rise in Park Shore offering estate-sized condos with panoramic Gulf and bay views.
Beachfront high-rise condominium in Naples with 75 residences, built in 1983, offering Gulf views and resort-style amenities.
 location
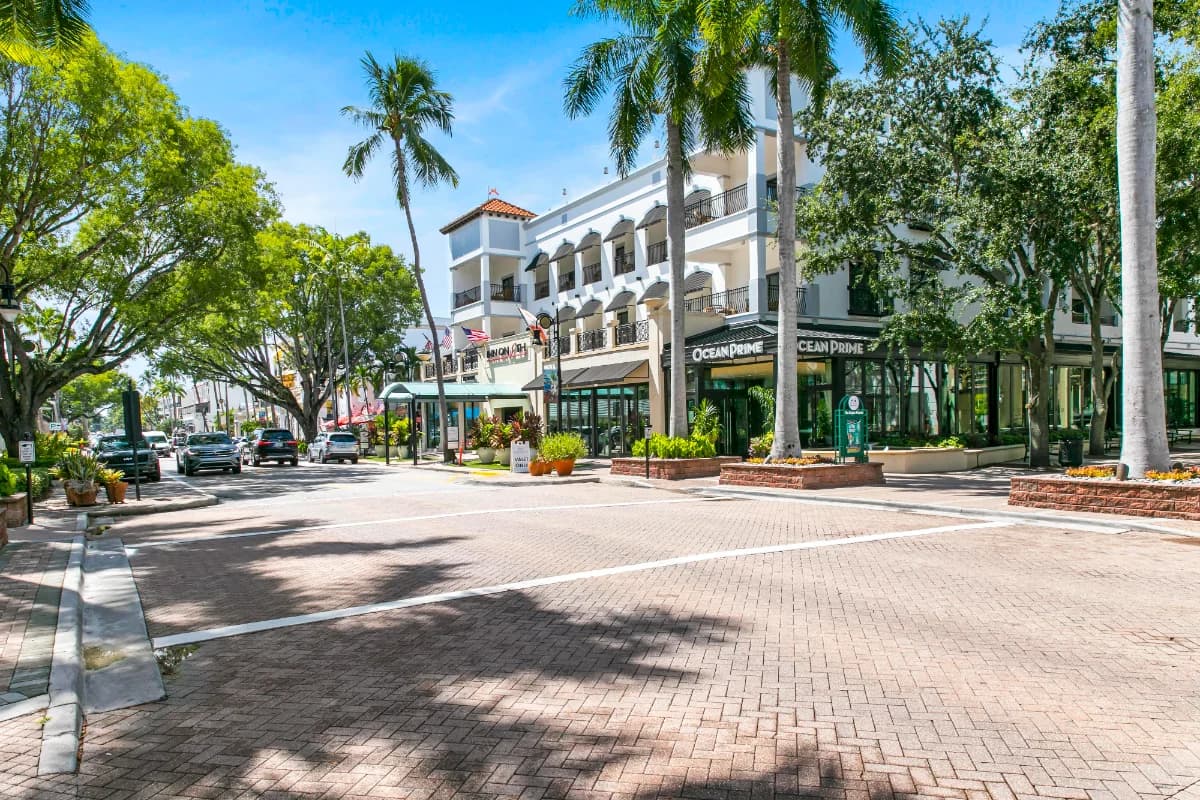
World-class beaches, golf, and coastal lifestyle in Southwest Florida.
 area
area location
Island living with white-sand beaches and boating lifestyle.
locationWorld-class beaches, golf, and coastal lifestyle in Southwest Florida.
arealocationIsland living with white-sand beaches and boating lifestyle.