 Bundled Golf
Naples • East Naples
Foxfire Country Club
Gated bundled golf community in Naples with 27 holes of Arthur Hills–designed golf and resort-style amenities close to downtown and the beaches.
Gated~$225k – $1.2M+
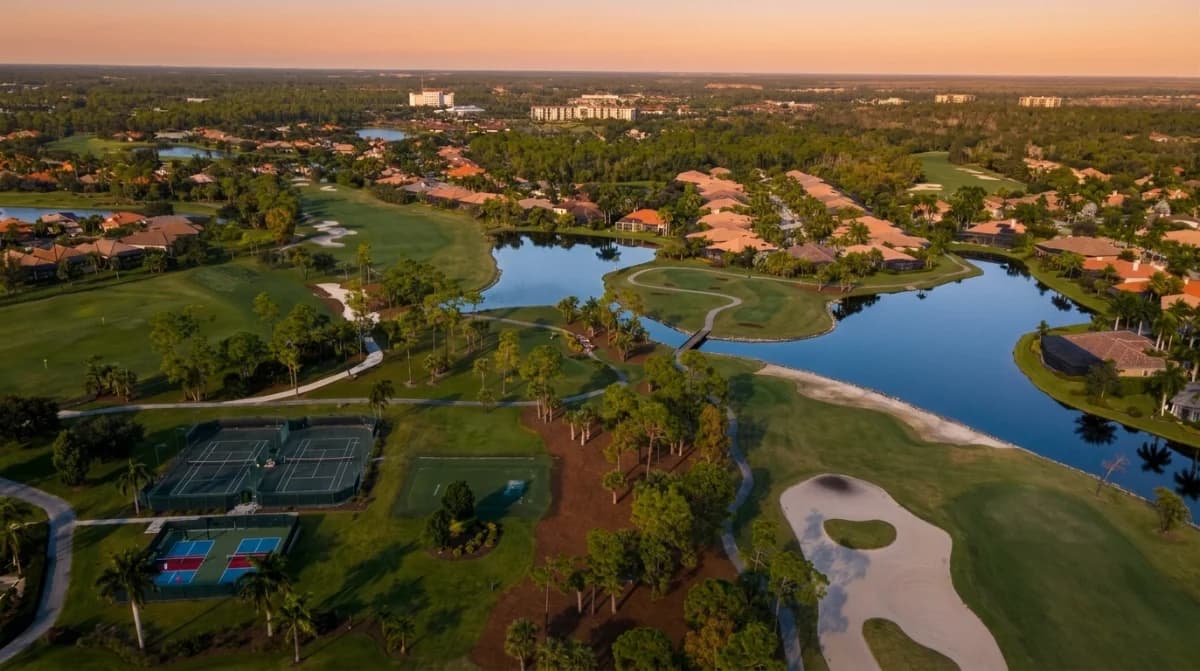
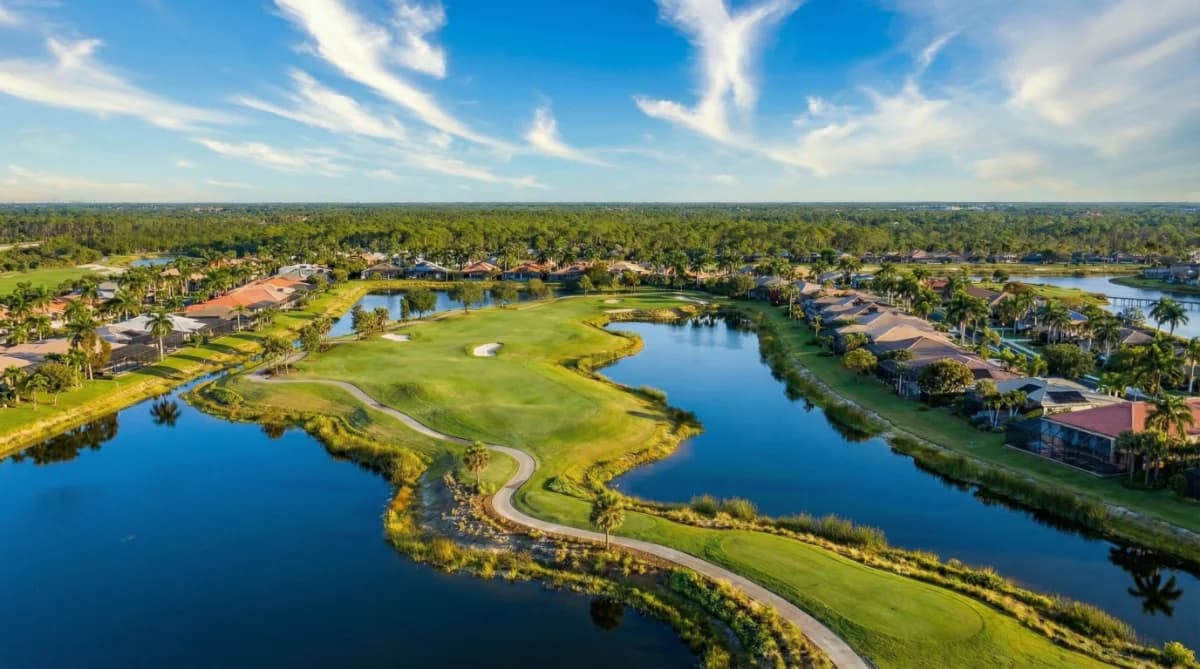
Lely Resort is a master-planned community in Naples, Florida, offering a resort lifestyle with golf and comprehensive amenities. The community features multiple neighborhoods with various home styles to suit different preferences and budgets.
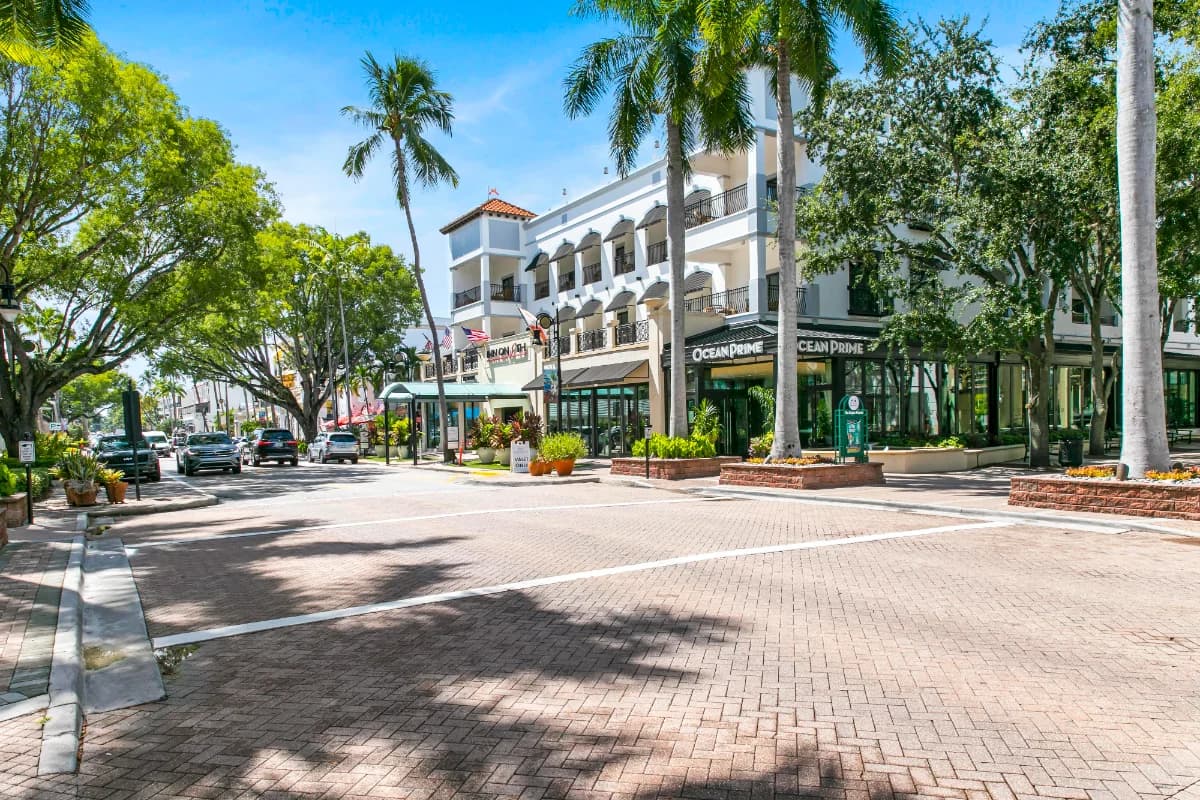
Located in Naples, Lely Resort provides convenient access to Southwest Florida''s beaches, shopping, and dining while maintaining a resort atmosphere within its gates.
Residents enjoy a resort-style lifestyle with golf courses, swimming facilities, and social amenities designed to create an active community atmosphere.
Here's a snapshot of the real estate market in Lely Resort, East Naples, as of early May 2026. The median sales price for all property types in April 2026 was $715,000. Broken out by property type, the median price for single-family homes was $1,165,000, while condos had a median price of $450,000. Inventory levels in Lely Resort continue to show strong activity. The total number of homes for sale in April 2026 was 145, consisting of 45 single-family homes and 100 condos. Inventory levels for all property types have decreased since January 2026, when there were 172 properties for sale. The months' supply of homes for sale in April 2026 was 7.5 for all property types. Sales activity in Lely Resort is healthy. Total sales in April 2026 reached 34, with 14 single-family homes and 20 condos sold. Pending sales also reflect this trend, with a total of 25 pending sales in April 2026, including 11 single-family homes and 14 condos. Price per square foot in Lely Resort was $353 for all property types in April 2026. Single-family homes had a median price per square foot of $491, while condos were at $291. This metric has fluctuated over the past year, with single-family homes showing more variability.
May 2026 · Last updated May 2, 2026
Track how home values are trending in Lely Resort. Median sale prices and price-per-square-foot data help buyers and sellers gauge current market positioning.
Median Closed Price
$522,500 as of June 2026, down 12.2% year-over-year.
| Month | Median Closed Price |
|---|---|
| July 2025 | $600,000 |
| August 2025 | $700,000 |
| September 2025 | $535,000 |
| October 2025 | $747,500 |
| November 2025 | $520,000 |
| December 2025 | $700,000 |
| January 2026 | $527,500 |
| February 2026 | $904,950 |
| March 2026 | $677,500 |
| April 2026 | $740,000 |
| May 2026 | $595,000 |
| June 2026 | $522,500 |
Source: Naples Area Board of REALTORS® (NABOR®) MLS, via InfoSparks. Data through June 2026. Data deemed reliable but not guaranteed.
Median Prices per Sq ft
$309 as of June 2026, down 1.3% year-over-year.
| Month | Median Prices per Sq ft |
|---|---|
| July 2025 | $296 |
| August 2025 | $360 |
| September 2025 | $295 |
| October 2025 | $363 |
| November 2025 | $277 |
| December 2025 | $324 |
| January 2026 | $320 |
| February 2026 | $391 |
| March 2026 | $311 |
| April 2026 | $365 |
| May 2026 | $333 |
| June 2026 | $309 |
Source: Naples Area Board of REALTORS® (NABOR®) MLS, via InfoSparks. Data through June 2026. Data deemed reliable but not guaranteed.
Median Closed Price
$522,500 as of June 2026, down 12.2% year-over-year.
| Month | Median Closed Price |
|---|---|
| July 2025 | $600,000 |
| August 2025 | $700,000 |
| September 2025 | $535,000 |
| October 2025 | $747,500 |
| November 2025 | $520,000 |
| December 2025 | $700,000 |
| January 2026 | $527,500 |
| February 2026 | $904,950 |
| March 2026 | $677,500 |
| April 2026 | $740,000 |
| May 2026 | $595,000 |
| June 2026 | $522,500 |
Source: Naples Area Board of REALTORS® (NABOR®) MLS, via InfoSparks. Data through June 2026. Data deemed reliable but not guaranteed.
$309 as of June 2026, down 1.3% year-over-year.
| Month | Median Prices per Sq ft |
|---|---|
| July 2025 | $296 |
| August 2025 | $360 |
| September 2025 | $295 |
| October 2025 | $363 |
| November 2025 | $277 |
| December 2025 | $324 |
| January 2026 | $320 |
| February 2026 | $391 |
| March 2026 | $311 |
| April 2026 | $365 |
| May 2026 | $333 |
| June 2026 | $309 |
Source: Naples Area Board of REALTORS® (NABOR®) MLS, via InfoSparks. Data through June 2026. Data deemed reliable but not guaranteed.
See how many homes are available in Lely Resort and how quickly inventory is moving. Months of supply indicates whether conditions favor buyers or sellers.
Homes For Sale
131 as of May 2026, down 33.5% year-over-year.
| Month | Homes For Sale |
|---|---|
| June 2025 | 176 |
| July 2025 | 151 |
| August 2025 | 128 |
| September 2025 | 122 |
| October 2025 | 147 |
| November 2025 | 143 |
| December 2025 | 144 |
| January 2026 | 173 |
| February 2026 | 174 |
| March 2026 | 164 |
| April 2026 | 145 |
| May 2026 | 131 |
Source: Naples Area Board of REALTORS® (NABOR®) MLS, via InfoSparks. Data through May 2026. Data deemed reliable but not guaranteed.
Months Supply
6.1 as of June 2026, down 45.0% year-over-year.
| Month | Months Supply |
|---|---|
| July 2025 | 10 |
| August 2025 | 8.1 |
| September 2025 | 7.5 |
| October 2025 | 8.9 |
| November 2025 | 8.1 |
| December 2025 | 7.9 |
| January 2026 | 9.7 |
| February 2026 | 9.9 |
| March 2026 | 8.9 |
| April 2026 | 7.5 |
| May 2026 | 6.8 |
| June 2026 | 6.1 |
Source: Naples Area Board of REALTORS® (NABOR®) MLS, via InfoSparks. Data through June 2026. Data deemed reliable but not guaranteed.
Homes For Sale
131 as of May 2026, down 33.5% year-over-year.
| Month | Homes For Sale |
|---|---|
| June 2025 | 176 |
| July 2025 | 151 |
| August 2025 | 128 |
| September 2025 | 122 |
| October 2025 | 147 |
| November 2025 | 143 |
| December 2025 | 144 |
| January 2026 | 173 |
| February 2026 | 174 |
| March 2026 | 164 |
| April 2026 | 145 |
| May 2026 | 131 |
Source: Naples Area Board of REALTORS® (NABOR®) MLS, via InfoSparks. Data through May 2026. Data deemed reliable but not guaranteed.
6.1 as of June 2026, down 45.0% year-over-year.
| Month | Months Supply |
|---|---|
| July 2025 | 10 |
| August 2025 | 8.1 |
| September 2025 | 7.5 |
| October 2025 | 8.9 |
| November 2025 | 8.1 |
| December 2025 | 7.9 |
| January 2026 | 9.7 |
| February 2026 | 9.9 |
| March 2026 | 8.9 |
| April 2026 | 7.5 |
| May 2026 | 6.8 |
| June 2026 | 6.1 |
Source: Naples Area Board of REALTORS® (NABOR®) MLS, via InfoSparks. Data through June 2026. Data deemed reliable but not guaranteed.
Monitor real estate transaction volume in Lely Resort. Pending and closed sales reflect the pace of buyer demand and overall market momentum.
Pending Sales
15 as of June 2026, up 87.5% year-over-year.
| Month | Pending Sales |
|---|---|
| July 2025 | 13 |
| August 2025 | 17 |
| September 2025 | 14 |
| October 2025 | 18 |
| November 2025 | 19 |
| December 2025 | 13 |
| January 2026 | 20 |
| February 2026 | 35 |
| March 2026 | 29 |
| April 2026 | 26 |
| May 2026 | 16 |
| June 2026 | 15 |
Source: Naples Area Board of REALTORS® (NABOR®) MLS, via InfoSparks. Data through June 2026. Data deemed reliable but not guaranteed.
Total Sales
18 as of June 2026, down 25.0% year-over-year.
| Month | Total Sales |
|---|---|
| July 2025 | 11 |
| August 2025 | 16 |
| September 2025 | 15 |
| October 2025 | 14 |
| November 2025 | 19 |
| December 2025 | 21 |
| January 2026 | 12 |
| February 2026 | 16 |
| March 2026 | 30 |
| April 2026 | 35 |
| May 2026 | 20 |
| June 2026 | 18 |
Source: Naples Area Board of REALTORS® (NABOR®) MLS, via InfoSparks. Data through June 2026. Data deemed reliable but not guaranteed.
Pending Sales
15 as of June 2026, up 87.5% year-over-year.
| Month | Pending Sales |
|---|---|
| July 2025 | 13 |
| August 2025 | 17 |
| September 2025 | 14 |
| October 2025 | 18 |
| November 2025 | 19 |
| December 2025 | 13 |
| January 2026 | 20 |
| February 2026 | 35 |
| March 2026 | 29 |
| April 2026 | 26 |
| May 2026 | 16 |
| June 2026 | 15 |
Source: Naples Area Board of REALTORS® (NABOR®) MLS, via InfoSparks. Data through June 2026. Data deemed reliable but not guaranteed.
18 as of June 2026, down 25.0% year-over-year.
| Month | Total Sales |
|---|---|
| July 2025 | 11 |
| August 2025 | 16 |
| September 2025 | 15 |
| October 2025 | 14 |
| November 2025 | 19 |
| December 2025 | 21 |
| January 2026 | 12 |
| February 2026 | 16 |
| March 2026 | 30 |
| April 2026 | 35 |
| May 2026 | 20 |
| June 2026 | 18 |
Source: Naples Area Board of REALTORS® (NABOR®) MLS, via InfoSparks. Data through June 2026. Data deemed reliable but not guaranteed.
Bundled GolfGated bundled golf community in Naples with 27 holes of Arthur Hills–designed golf and resort-style amenities close to downtown and the beaches.
 community
Luxury golf club community spanning 1,115 acres in Naples with championship golf, dining, and resort-style amenities.
 community
Private, gated bundled golf community in East Naples with an Arnold Palmer Signature course and resort-style amenities.
Bundled GolfGated bundled golf community in Naples with 27 holes of Arthur Hills–designed golf and resort-style amenities close to downtown and the beaches.
communityLuxury golf club community spanning 1,115 acres in Naples with championship golf, dining, and resort-style amenities.
communityPrivate, gated bundled golf community in East Naples with an Arnold Palmer Signature course and resort-style amenities.
 location
World-class beaches, golf, and coastal lifestyle in Southwest Florida.
 area
area location
Island living with white-sand beaches and boating lifestyle.
locationWorld-class beaches, golf, and coastal lifestyle in Southwest Florida.
arealocationIsland living with white-sand beaches and boating lifestyle.