 building
Naples • Moorings
Billows
Beachfront cooperative community in The Moorings with 48 residences across four low-rise buildings.
~$950k+
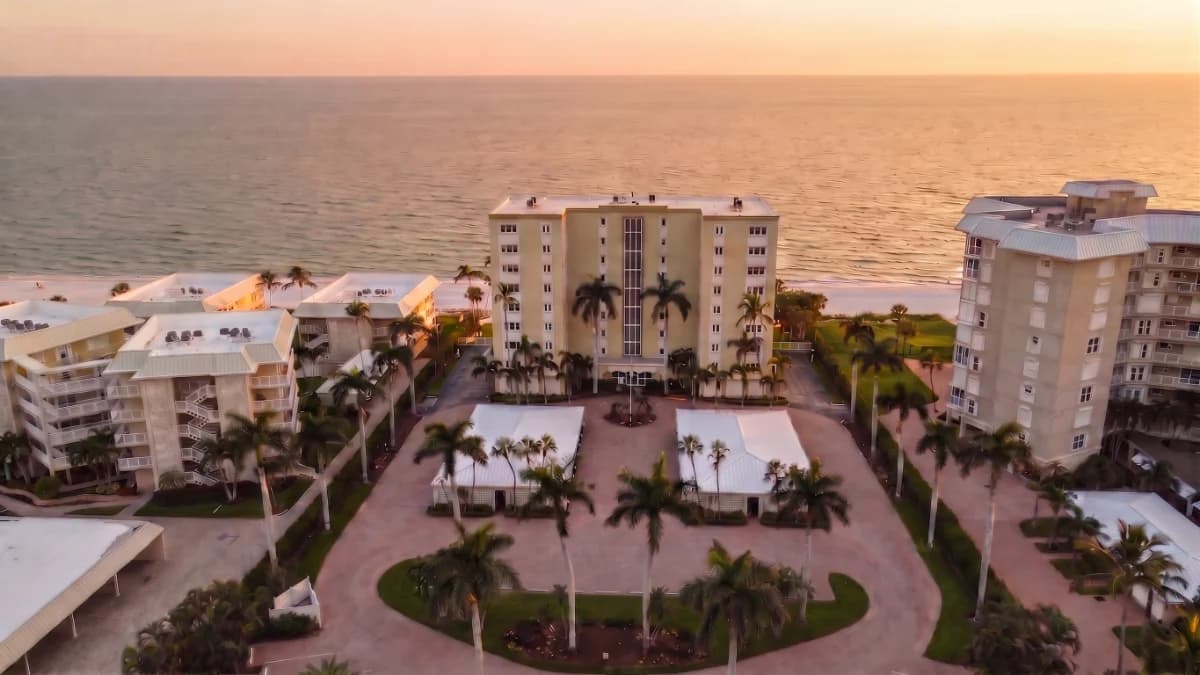
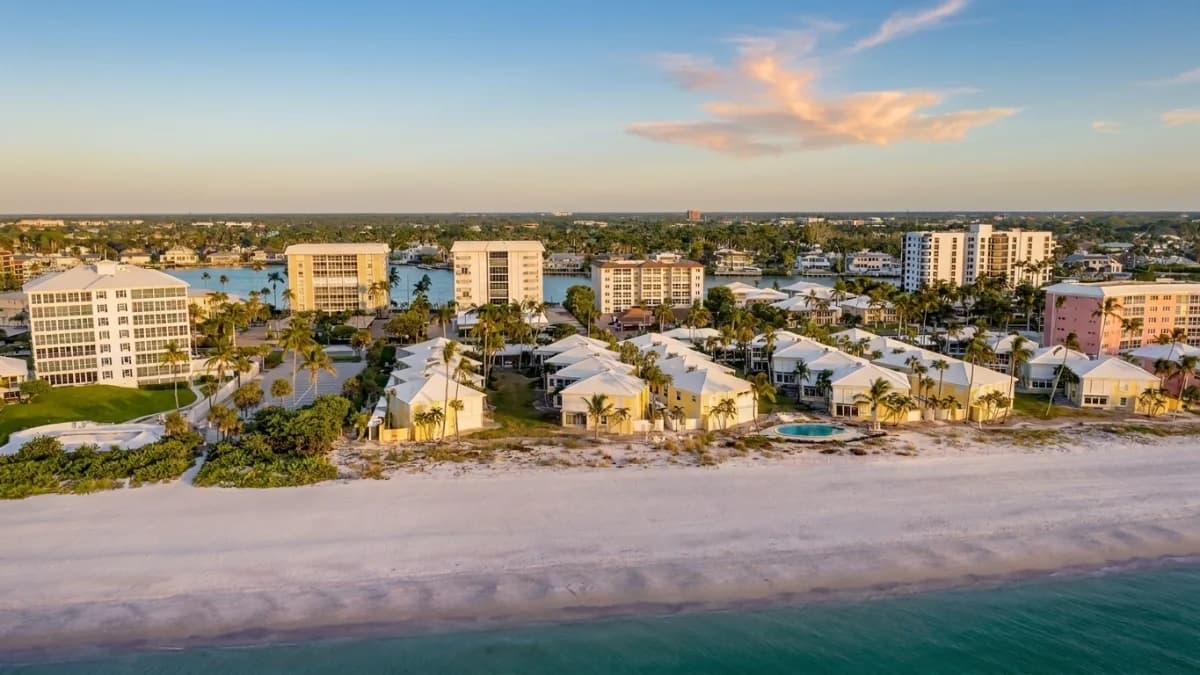
Jamaica Towers is a beachfront condominium building located at 2885 Gulf Shore Boulevard North in the prestigious Moorings neighborhood of Naples. Built in 1969, this 9-story building offers 32 exclusive residences with direct beach access and stunning Gulf of Mexico views.
Situated right on the beach adjacent to Westgate and just south of the intersection of Gulf Shore Boulevard North and Harbour Drive, Jamaica Towers provides residents with an unparalleled beachfront lifestyle in one of Naples'' most desirable neighborhoods.
The building features a beautiful beachfront pool, covered parking, bike storage, picnic area with BBQ facilities, and a library. Residents enjoy private beach access and the convenience of covered parking spaces.
Units at Jamaica Towers range from 1,470 to 1,969 square feet of living space, offering spacious floor plans with beachfront views. Each residence comes with at least one covered parking space, with some units having two spaces based on seniority.
Jamaica Towers maintains a pet-free environment and allows one lease per unit per year with a minimum 90-day term, making it ideal for seasonal residents or those seeking rental income opportunities.
Here's a snapshot of the real estate market in Jamaica Towers, located in the Moorings area of Naples. As of early May 2026, the data shows that market activity is concentrated on condos, with no recent single-family home sales to report. The total number of sales in Jamaica Towers has been sporadic; there were single condo sales in February, June, and July of 2023, and also in April 2024 and May 2025. Focusing on condo pricing trends, the median sale price has fluctuated. In February 2023, the median price was $1,925,000, rising to $2,750,000 in June 2023, then dropping to $2,400,000 in July 2023. More recently, the median sales price for condos was $1,725,000 in April 2024 and $1,600,000 in May 2025. The median price per square foot for condos also saw some variation, with values of $1,310 in February 2023, $1,397 in June 2023, $1,600 in July 2023, $1,185 in April 2024, and $1,011 in May 2025. Inventory levels in Jamaica Towers have also varied. Months' supply of homes for sale was at 2 months in March and April 2024, dropping to 0.5 months between July and December 2024, before rising back to 1 month between October 2025 and February 2026, then reaching 2 months in March 2026. The number of homes for sale in April 2026 was zero, while pending sales in April 2026 stood at 2.
May 2026 · Last updated May 2, 2026
Track how home values are trending in Jamaica Towers. Median sale prices and price-per-square-foot data help buyers and sellers gauge current market positioning.
Median Closed Price
$1,900,000 as of May 2026.
| Month | Median Closed Price |
|---|---|
| February 2023 | $1,925,000 |
| June 2023 | $2,750,000 |
| July 2023 | $2,400,000 |
| April 2024 | $1,725,000 |
| May 2025 | $1,600,000 |
| May 2026 | $1,900,000 |
Source: Naples Area Board of REALTORS® (NABOR®) MLS, via InfoSparks. Data through May 2026. Data deemed reliable but not guaranteed.
Median Prices per Sq ft
$965 as of May 2026.
| Month | Median Prices per Sq ft |
|---|---|
| February 2023 | $1,310 |
| June 2023 | $1,397 |
| July 2023 | $1,600 |
| April 2024 | $1,185 |
| May 2025 | $1,011 |
| May 2026 | $965 |
Source: Naples Area Board of REALTORS® (NABOR®) MLS, via InfoSparks. Data through May 2026. Data deemed reliable but not guaranteed.
Median Closed Price
$1,900,000 as of May 2026.
| Month | Median Closed Price |
|---|---|
| February 2023 | $1,925,000 |
| June 2023 | $2,750,000 |
| July 2023 | $2,400,000 |
| April 2024 | $1,725,000 |
| May 2025 | $1,600,000 |
| May 2026 | $1,900,000 |
Source: Naples Area Board of REALTORS® (NABOR®) MLS, via InfoSparks. Data through May 2026. Data deemed reliable but not guaranteed.
$965 as of May 2026.
| Month | Median Prices per Sq ft |
|---|---|
| February 2023 | $1,310 |
| June 2023 | $1,397 |
| July 2023 | $1,600 |
| April 2024 | $1,185 |
| May 2025 | $1,011 |
| May 2026 | $965 |
Source: Naples Area Board of REALTORS® (NABOR®) MLS, via InfoSparks. Data through May 2026. Data deemed reliable but not guaranteed.
See how many homes are available in Jamaica Towers and how quickly inventory is moving. Months of supply indicates whether conditions favor buyers or sellers.
Homes For Sale
1 as of May 2026.
| Month | Homes For Sale |
|---|---|
| June 2025 | 0 |
| July 2025 | 0 |
| August 2025 | 0 |
| September 2025 | 0 |
| October 2025 | 1 |
| November 2025 | 1 |
| December 2025 | 1 |
| January 2026 | 1 |
| February 2026 | 1 |
| March 2026 | 2 |
| April 2026 | 1 |
| May 2026 | 1 |
Source: Naples Area Board of REALTORS® (NABOR®) MLS, via InfoSparks. Data through May 2026. Data deemed reliable but not guaranteed.
Months Supply
1 as of June 2026.
| Month | Months Supply |
|---|---|
| December 2024 | 0.5 |
| January 2025 | 0.5 |
| February 2025 | 0.5 |
| October 2025 | 1 |
| November 2025 | 1 |
| December 2025 | 1 |
| January 2026 | 1 |
| February 2026 | 1 |
| March 2026 | 2 |
| April 2026 | 1 |
| May 2026 | 1 |
| June 2026 | 1 |
Source: Naples Area Board of REALTORS® (NABOR®) MLS, via InfoSparks. Data through June 2026. Data deemed reliable but not guaranteed.
Homes For Sale
1 as of May 2026.
| Month | Homes For Sale |
|---|---|
| June 2025 | 0 |
| July 2025 | 0 |
| August 2025 | 0 |
| September 2025 | 0 |
| October 2025 | 1 |
| November 2025 | 1 |
| December 2025 | 1 |
| January 2026 | 1 |
| February 2026 | 1 |
| March 2026 | 2 |
| April 2026 | 1 |
| May 2026 | 1 |
Source: Naples Area Board of REALTORS® (NABOR®) MLS, via InfoSparks. Data through May 2026. Data deemed reliable but not guaranteed.
1 as of June 2026.
| Month | Months Supply |
|---|---|
| December 2024 | 0.5 |
| January 2025 | 0.5 |
| February 2025 | 0.5 |
| October 2025 | 1 |
| November 2025 | 1 |
| December 2025 | 1 |
| January 2026 | 1 |
| February 2026 | 1 |
| March 2026 | 2 |
| April 2026 | 1 |
| May 2026 | 1 |
| June 2026 | 1 |
Source: Naples Area Board of REALTORS® (NABOR®) MLS, via InfoSparks. Data through June 2026. Data deemed reliable but not guaranteed.
Monitor real estate transaction volume in Jamaica Towers. Pending and closed sales reflect the pace of buyer demand and overall market momentum.
Pending Sales
0 as of May 2026.
| Month | Pending Sales |
|---|---|
| June 2025 | 0 |
| July 2025 | 0 |
| August 2025 | 0 |
| September 2025 | 0 |
| October 2025 | 0 |
| November 2025 | 0 |
| December 2025 | 0 |
| January 2026 | 0 |
| February 2026 | 0 |
| March 2026 | 0 |
| April 2026 | 1 |
| May 2026 | 0 |
Source: Naples Area Board of REALTORS® (NABOR®) MLS, via InfoSparks. Data through May 2026. Data deemed reliable but not guaranteed.
Total Sales
0 as of June 2026.
| Month | Total Sales |
|---|---|
| July 2025 | 0 |
| August 2025 | 0 |
| September 2025 | 0 |
| October 2025 | 0 |
| November 2025 | 0 |
| December 2025 | 0 |
| January 2026 | 0 |
| February 2026 | 0 |
| March 2026 | 0 |
| April 2026 | 0 |
| May 2026 | 1 |
| June 2026 | 0 |
Source: Naples Area Board of REALTORS® (NABOR®) MLS, via InfoSparks. Data through June 2026. Data deemed reliable but not guaranteed.
Pending Sales
0 as of May 2026.
| Month | Pending Sales |
|---|---|
| June 2025 | 0 |
| July 2025 | 0 |
| August 2025 | 0 |
| September 2025 | 0 |
| October 2025 | 0 |
| November 2025 | 0 |
| December 2025 | 0 |
| January 2026 | 0 |
| February 2026 | 0 |
| March 2026 | 0 |
| April 2026 | 1 |
| May 2026 | 0 |
Source: Naples Area Board of REALTORS® (NABOR®) MLS, via InfoSparks. Data through May 2026. Data deemed reliable but not guaranteed.
0 as of June 2026.
| Month | Total Sales |
|---|---|
| July 2025 | 0 |
| August 2025 | 0 |
| September 2025 | 0 |
| October 2025 | 0 |
| November 2025 | 0 |
| December 2025 | 0 |
| January 2026 | 0 |
| February 2026 | 0 |
| March 2026 | 0 |
| April 2026 | 0 |
| May 2026 | 1 |
| June 2026 | 0 |
Source: Naples Area Board of REALTORS® (NABOR®) MLS, via InfoSparks. Data through June 2026. Data deemed reliable but not guaranteed.
buildingBeachfront cooperative community in The Moorings with 48 residences across four low-rise buildings.
Exclusive beachfront cooperative in Moorings with 33 residences, built in 1971, offering private beach access and luxury coastal living.
Bayfront luxury condominiums in the Moorings with Gulf views, boat slips, and beach access.
 location
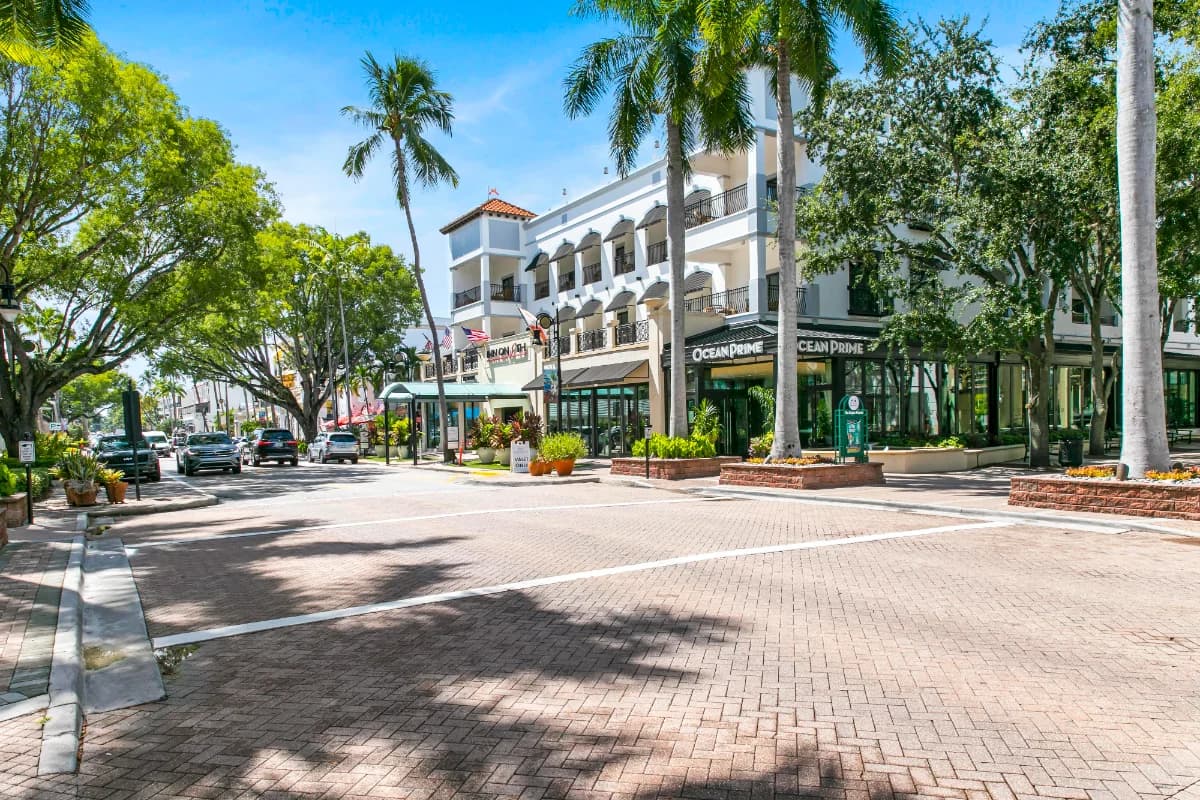
World-class beaches, golf, and coastal lifestyle in Southwest Florida.
 area
area location
Island living with white-sand beaches and boating lifestyle.
locationWorld-class beaches, golf, and coastal lifestyle in Southwest Florida.
arealocationIsland living with white-sand beaches and boating lifestyle.